Let’s try to fix the issue with Intune Diagnostics Settings Log Analytics Azure Subscription Missing Issue. Once the Diagnostics Settings configuration is completed, you can use Intune KQL query to create Dashboards and Detailed Reports.
The Intune KQL queries are also helpful for troubleshooting issues. Azure Subscription missing from the drop-down list is one of the first issues you might face when setting up Intune Diagnostics Settings using the Log Analytics workspace.
First thing first, don’t get confused with Diagnostics settings and Device Diagnostics. Both are different features and different purposes. Device Diagnostics is the feature that helps admins to collect the logs of the devices that are Intune managed using MEM Intune Portal.
Intune Diagnostics settings feature is used to export platform logs; in this scenario, it’s Intune platform logs to any of the 3 destinations of choice. This also includes collecting the metrics for a resource from that platform and sending it to the log analytics workspace or any other supported destination of your choice.
I have covered an update compliance topic and sent the Software Update or patching data to the log analytics workspace using a slightly different method (commercial ID). The following are some of the Intune default reports that are readily available.
- Sign-in Activity Reports in Intune portal | Endpoint Manager
- Intune Device Compliance Reports | Endpoint Manager
- Azure Active Directory sign-in activity reports
What are Intune Diagnostics Settings?
Intune Diagnostics settings are used to configure and export platform logs and metrics for an Intune resource to any of the 3 supported destinations of your choice. You can create a maximum of 5 different diagnostics settings to send various logs and metrics to independent destinations.
Once Intune platform logs and metrics are available in the log analytics workspace, you can use very Powerful KQL query language to analyze and produce dashboards.
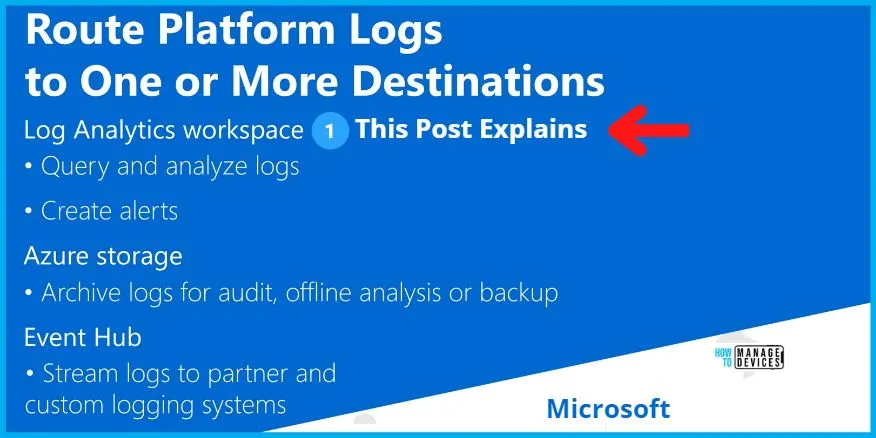
For Intune platform, there are 4 different categories of platform logs and metrics available. There are methods to troubleshoot issues using log analytics and KQL queries. I have explained this patching process -> Update Compliance Queries To Troubleshoot Intune WUfB Patch Deployment.
The following are the 4 platform logs that are part of Intune diagnostics settings.
- Audit Logs – shows a record of activities that generate a change in Intune, including create, update (edit), delete, assign, and remote actions.
- Operational Logs – show details on users and devices that successfully (or failed) enroll and details on non-compliant devices.
- DeviceComplianceOrg – Device Compliance Organizational Logs show an organizational report for device compliance in Intune and details on non-compliant devices.
- Devices – IntuneDevices show device inventory and status information for Intune enrolled and managed devices.
Prerequisites to enable Intune Diagnostics Settings
To enable Intune Diagnostics Settings, you need to go through and complete the prerequisites listed below. You should have a valid Azure Subscription with appropriate permissions to access the log analytics workspace.
- Intune Permissions to configure Diagnostics Settings from Tenant Admin/Reporting blade.
- Ready to use Log Analytics Workspace.
- Azure Subscription permissions to select the appropriate Log Analytics Workspace.
How to Create Log Analytics Workspace
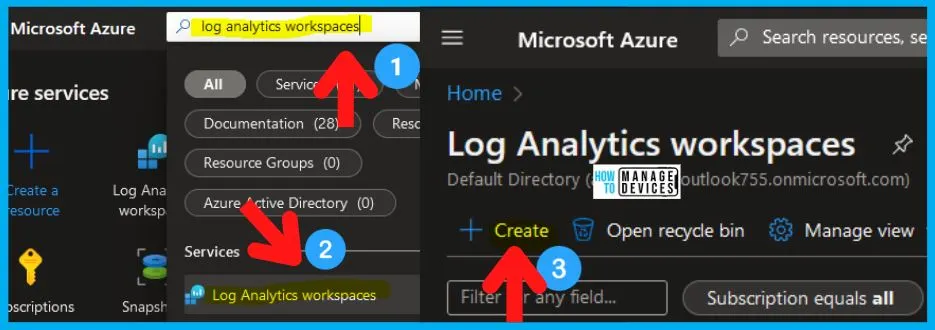
- Login to Portal.Azure.com -> Search “log analytics workspaces.”
- Open Log Analytics Workspaces Azure Service.
- Click on Create button to start the Log Analytics Workspace for Intune Diagnostics Settings.
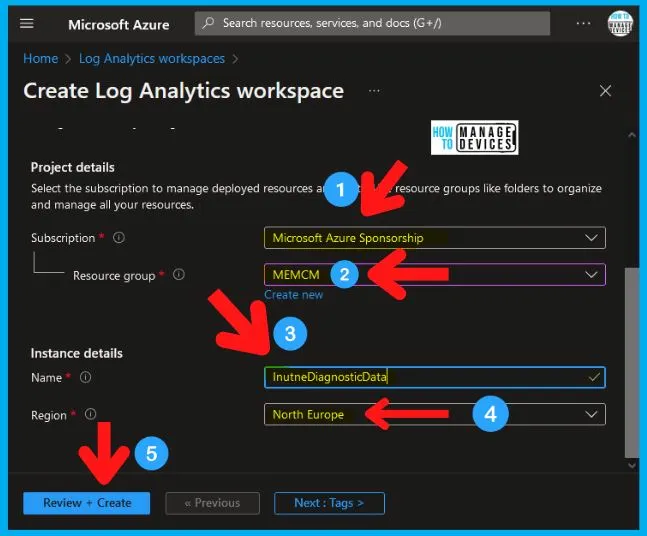
It’s time to select the Azure subscription to manage deployed resources and costs for Log Analytics Workspace. You can create a new Resource Group if you want but make sure to use existing ones if there are any.
With Azure Monitor Logs, you can easily store, retain, and query data collected from your monitored resources in Azure and other environments for valuable insights. A Log Analytics workspace is the logical storage unit where your log data is collected and stored.
TIP: Use resource groups like folders to organize and manage your resources. Diagnostics settings do not support resourceIDs with non-ASCII characters; more details are in the below section.
- Select the Azure Subscription (hoping that you have appropriate permissions).
- Select Resource Group where the Log Analytics Resources will be placed.
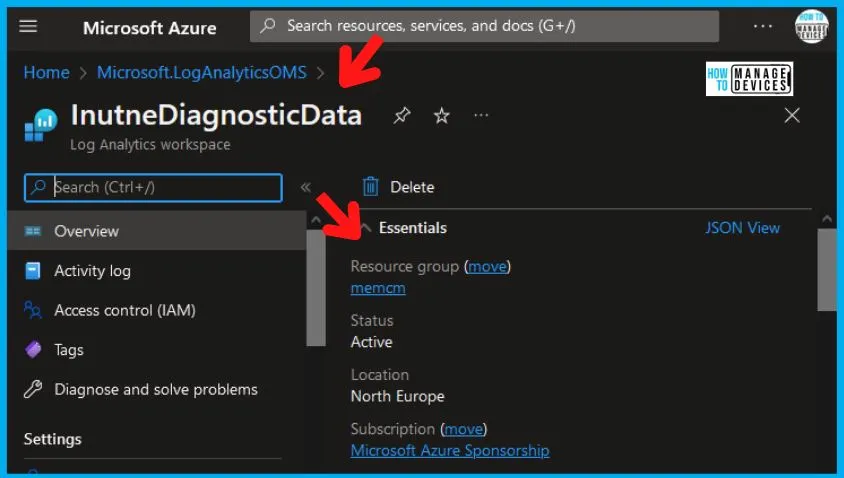
- Enter the Name of the Log Analytics Workspace -> InutneDiagnosticData
- The workspace name should include 4-63 letters, digits, or ‘-‘. The ‘-‘ shouldn’t be the first or the last symbol.
- Select the appropriate Azure Region to store this Intune Diagnostics Settings data -> North Europe.
You need to provide appropriate Tags on the next page for better management of resources. Click on the Review + Create button to validate the configurations, and then click on the Create button to start the Azure Log Analytics Workspace for Intune Diagnostics Settings data creation process.
It’s interesting to see OMS (example, Microsoft.LogAnalyticsOMS) in some places while creating Azure Log Analytics Workspace. OMS is the old product name of Log Analytics. The Log Analytics Workspace is already created!
- Antivirus Agent Status Intune Report | Endpoint Manager
- Intune Co-Management Workloads Report | Endpoint Manager
Setup Intune Diagnostics Settings Log Analytics
Let’s try to setup Intune Diagnostics Settings Log Analytics in this section. You will need to ensure you have completed all the previous sections of this post. You have created the new log analytics workspace, but there is no need to create one if you already have one.
Let’s go through the following steps to complete the task.
- Login to the MEM Admin center portal endpoint.microsoft.com.
- Navigate to Tenant Admin blade, then to Diagnostics Settings.
- Click on Add Diagnostic Setting link to add the export option to the newly created (or existing) Log Analytics Workspace.
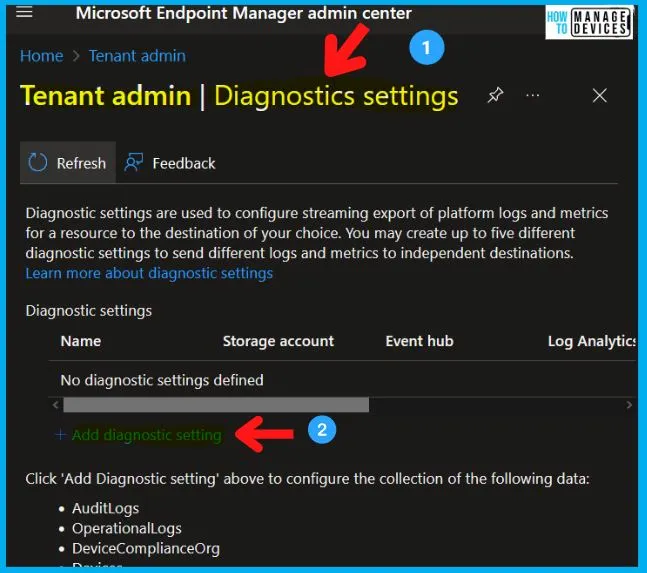
It’s time to configure the Intune Diagnostics Settings and send logs and metrics to Log Analytics. Other export options include Archive to a storage account, Stream to event hub, or Send to partner solution.
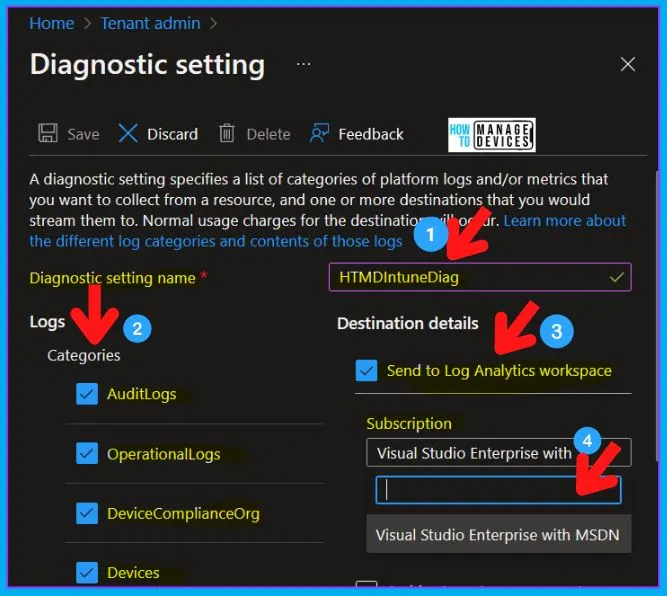
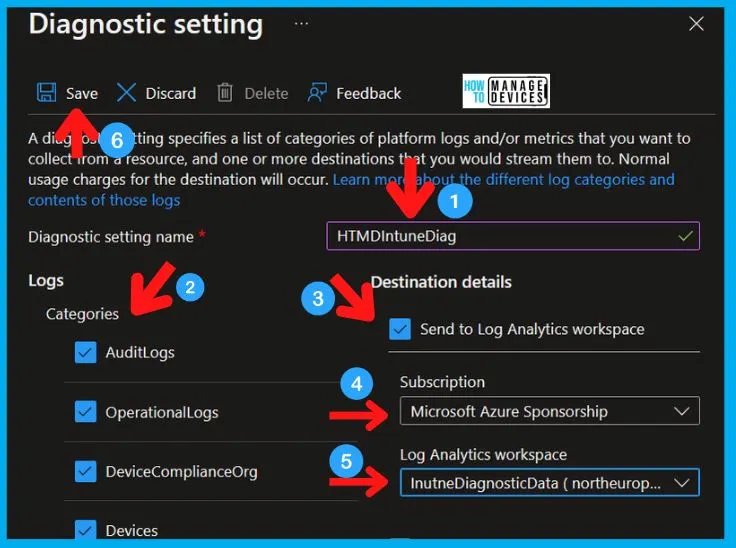
I normally recommend sending all log categories (4) to log analytics so you can have all the details in the workspace. Also, you can use KQL queries to troubleshoot Intune issues. Let’s follow the steps:
- Enter the name for the Diagnostic setting: HTMDIntuneDiag
- Select the Log Categories from the list:
- AuditLogs
- OperationalLogs
- DeviceComplianceOrg
- Devices
- Destinations from the Destination Details from now.
- Click on Send Log Analytics Workspace option.
- Select Azure Subscription from the drop-down list.
- Select Log Analytics Workspace from the drop-down list.
The problem that I have now is I have a problem here. I can’t see the Azure Subscription I wanted to select and the one I created in the above section. Let’s check how to fix the missing subscription issue with Intune diagnostic settings.
- Windows 10 or 11 Feature Update Intune Report | Endpoint Manager
- How to Use Group Policy Analytics in Intune Portal | Endpoint Manager
FIX Log Analytics Azure Subscription Missing Issue
Let’s check how to fix Log Analytics Subscription is not Missing Issue for Intune Diagnostics Settings. I have faced the Azure Subscription select issue. I could not find the Subscription used to create a log analytics workspace in the above section.
I have full permission on that Azure Subscription, but it’s visible or available in the drop-down list in Send Log Analytics Workspace section, as shown in the above screenshot.
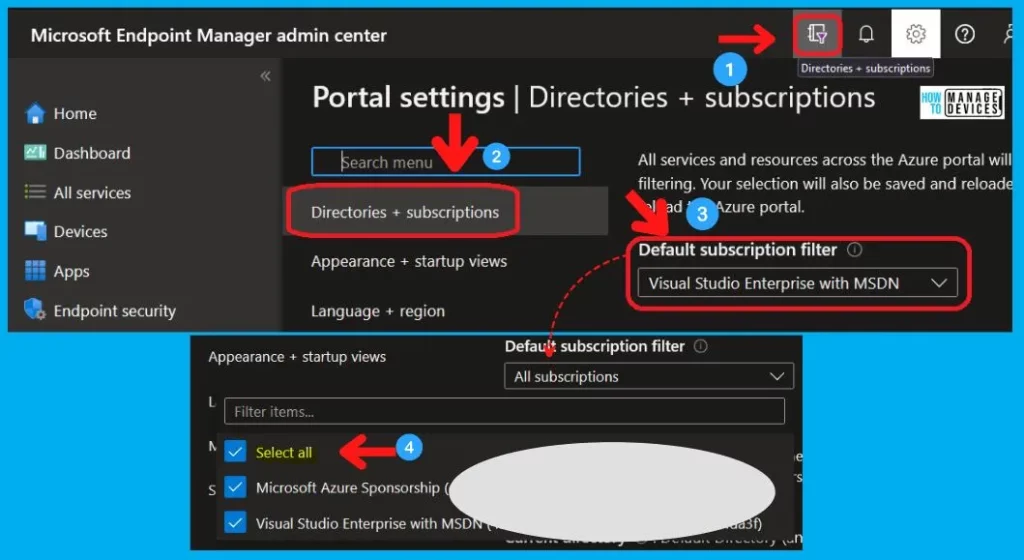
The solution for this issue is pretty straightforward, and you need to ensure that all the subscriptions are selected in the Default Subscription Filter. More details are available in the below screenshot. Normally, the MEM portal will show data only for these selected subscriptions on portal launch.
NOTE! – All services and resources across the Azure portal will inherit the selection from basic filtering. Your selection will also be saved and reloaded the next time you sign in or reload the Azure portal.
- Click on the FILTER icon for Directories + Subscriptions in the MEM Admin Center portal.
- Click on the Drop-Down option in the Default Subscription Filter.
- Click on the All Subscriptions option.
- Click on the X symbol to close the filter blade.
How to Send Intune Diagnostics Settings Data to Log Analytics
Let’s check How to send Intune Diagnostics Settings Data to Log Analytics. The Azure Subscription missing issue is fixed now, so I can resume from where I left it in the 2 sections above.
- Refresh the MEM Admin Center portal.
- Enter the name for the Diagnostic setting: HTMDIntuneDiag
- Select the Log Categories from the list:
- AuditLogs
- OperationalLogs
- DeviceComplianceOrg
- Devices
- Select one of the Destinations from the Destination Details
- Click on Send Log Analytics Workspace option
- Select Azure Subscription from the drop-down list.
- Select Log Analytics Workspace from the drop-down list
- Click on the SAVE button to complete the process.
It takes time to populate the logs and details into the Log Analytics. Don’t rush ahead and check the Logs blade in the Log Analytics workspace immediately after the above-mentioned configuration. Give it some time!
Intune KQL Query to Find HP or DELL Devices
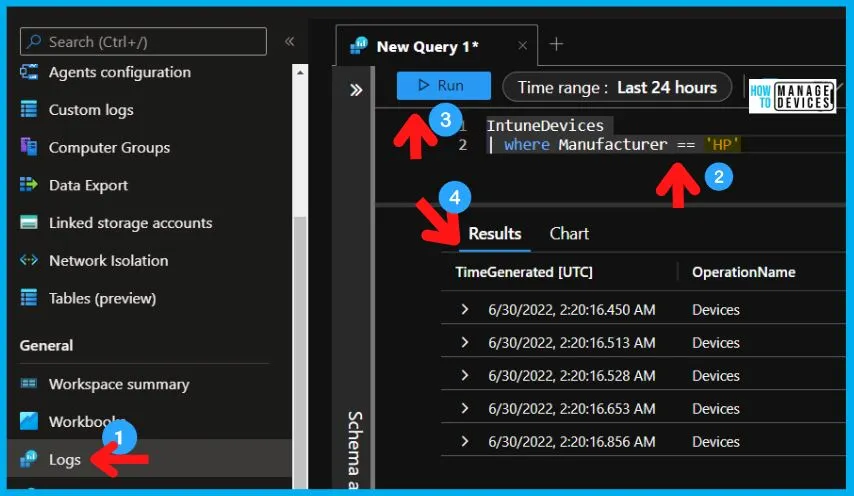
I have exported the Intune Diagnostics Settings data to Log Analytics. I can now check and find Dell or HP Devices from Intune Platform Logs using KQL queries. The table you need to check to find Dell or HP manufactured devices data is IntuneDevices.
First, you need to open the IntuneDiagnosticData workspace (or whatever name you have given to the Log Analytics Workspace) that is created in this exercise. You can use the following steps to open the Log Analytics Workspace.
- Login to Portal.Azure.com -> Search “log analytics workspaces.”
- Open Log Analytics Workspaces Azure Service.
- Open the IntuneDiagnosticData workspace.
- Navigate to Logs Tab.
- Close the Queries pop blade.
- Check whether the Tables are listed there or not. If the tables are not created, you need to wait until they get populated.
- In the KQL Query Box, Type in the following query to get the HP or Dell Manufactured devices list.
IntuneDevices | where Manufacturer == 'HP'
IntuneDevices | where Manufacturer == 'Dell'
NOTE! – There is a shortcut to open the IntuneDiagnosticData log analytics workspace from the MEM Admin portal directly. -> Navigate to Tenant Admin blade, then to Diagnostics Settings.
Intune KQL Query to Find Non-Compliant Devices
I can now check and find Non-Compliant Devices from Intune Platform Logs using KQL queries. The table that you have to check for non-compliant device data is IntuneDeviceComplianceOrg.
IntuneDeviceComplianceOrg | where ComplianceState != 'Compliant'Intune KQL Query to Find Who Delete Application or Policy
Let’s check who deleted the Application or Policy using Intune KQL Queries. You must collect the Intune Audit logs and send them to Log Analytics using Diagnostics Settings Data to retrieve these details using Intune KQL query.
Try using the following Intune KQL query to find the Intune Admin Audit activities, such as:
- Who deleted the Configuration Policy from MEM Intune?
- Who deleted the Setting Catalog Policy from MEM Intune?
- Who deleted the application from Intune?
IntuneAuditLogs | where OperationName contains "Delete"Intune KQL Query to Find the Status of ESP Enrollments
Let’s now try to find and troubleshoot using Intune KQL queries. Intune KQL Queries can help here to find the Status of ESP Enrollment. The Intune Diagnostics Settings table you need to use to retrieve Operational details is IntuneOperationalLogs.
IntuneOperationalLogs | where OperationName == 'ESPEnrollment'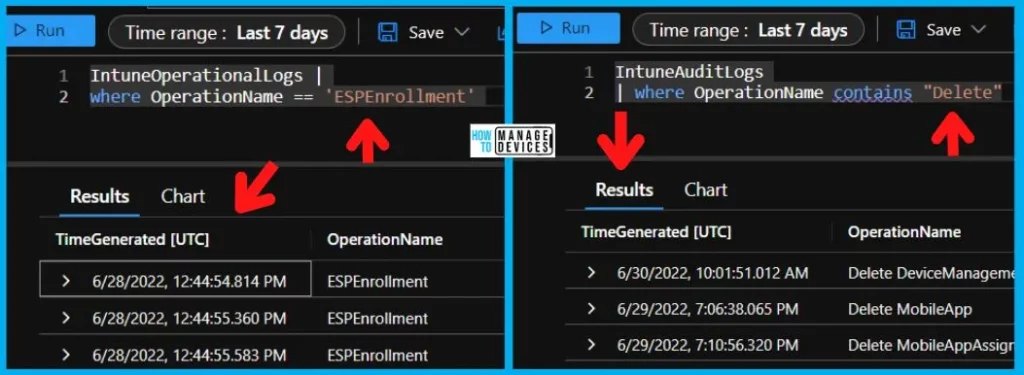
Known Issue with Diagnostic settings
Diagnostic Settings might disappear due to non-ASCII characters in resourceID. Microsoft has documented this as one of the things that you need to take care of when you create naming standards for Resources in Azure.
Diagnostic settings do not support resourceIDs with non-ASCII characters (for example, Preproducción). The biggest challenge is that you cannot rename resources in Azure. The only option to fix this issue is given below.
The only option is to create a new resource without the non-ASCII characters. If the characters are in a resource group, you can move the resources under it to a new one. Otherwise, you’ll need to recreate the resource.
Metric category ‘—-‘ is not supported is another common error that has been seen with Diagnostic Settings configurations. If you receive this error, update your deployments to replace any metric category names with ‘AllMetrics’ to fix the issue.
If the deployment previously added multiple categories, only one with the ‘AllMetrics‘ reference should be kept. If you continue to have the problem, contact Azure support through the Azure portal.
Author
Anoop is Microsoft MVP! He is a Device Management Admin with more than 21 years of experience (calculation done in 2022) in IT. He is Blogger, Speaker, and Local User Group HTMD Community leader. His main focus is on Device Management technologies like SCCM 2012, Current Branch, and Intune. He writes about ConfigMgr, Windows 11, Windows 10, Azure AD, Microsoft Intune, Windows 365, AVD, etc.


