This post is all about the new kid on the block—MEM Endpoint Analytics. Endpoint Analytics (currently in public preview!) is a new analytics solution from Microsoft that aims to improve user productivity by shifting the focus of IT efforts to being proactive rather than reactive.
But to be proactive, you need insights into data that you can use as metrics to compare and decide. That is what Endpoint Analytics is all about. There are three functionalities on offer:
Microsoft Endpoint Analytics is a valuable monitoring service within Microsoft Endpoint Manager, offering organizations detailed information about their Windows estate. It also contributes to the Microsoft Productivity Score by providing essential metrics, insights, and suggested actions to enhance the efficient utilization of Microsoft 365.
Through the reports in Endpoint Analytics, administrators gain valuable insights into user behavior and Windows 10 performance. This, in turn, enables businesses to assess the quality of the end-user experience without relying solely on direct user feedback.
In this post, we will review these features and examine their benefits. So, let’s get started.
- ConfigMgr Enable Upload Endpoint Analytics Data | SCCM HTMD Blog (anoopcnair.com)
- Cloud PC Health Performance Monitoring Using Endpoint Analytics using Intune.
License Requirements for MEM Endpoint Analytics
Endpoint Analytics is available with the following license plans
- EMS E3/E5
- M365 E3/E5
If you are an EMS license plan subscriber-only, you would also need Windows 10 Enterprise E3/E5 (or Windows 10 Education A3/A5 or Windows Virtual Desktop Access E3/E5) licenses.
Check the license requirement for Endpoint Analytics as stated by Microsoft.
Startup Performance – MEM Endpoint Analytics
Startup Performance gives you insight into how your managed endpoints are performing in terms of boot times—how long it takes for the device to be ready since the power is on for the end-user to be productive.
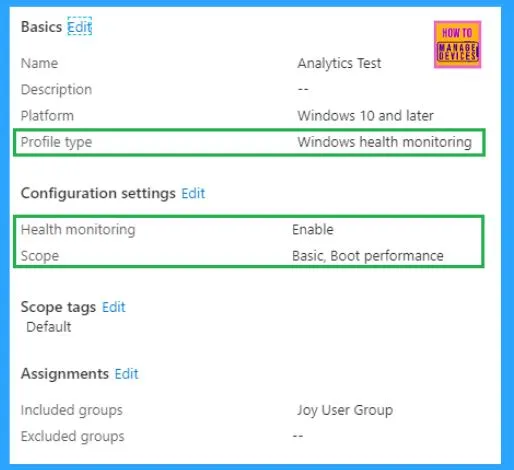
This, however, requires a Windows Health Monitoring policy to be deployed to the endpoints.
Note: Startup Performance monitoring currently only supports Windows 10 Enterprise or Education SKU version 1903 and above. At the time of writing this post, it does not support Windows 10 Pro.
IMPORTANT: The endpoint must be restarted after confirmation of successful policy deployment. After restart, the endpoint sends analytics data to the backend service for processing, and results may take up to 25 hours to post in the admin console.
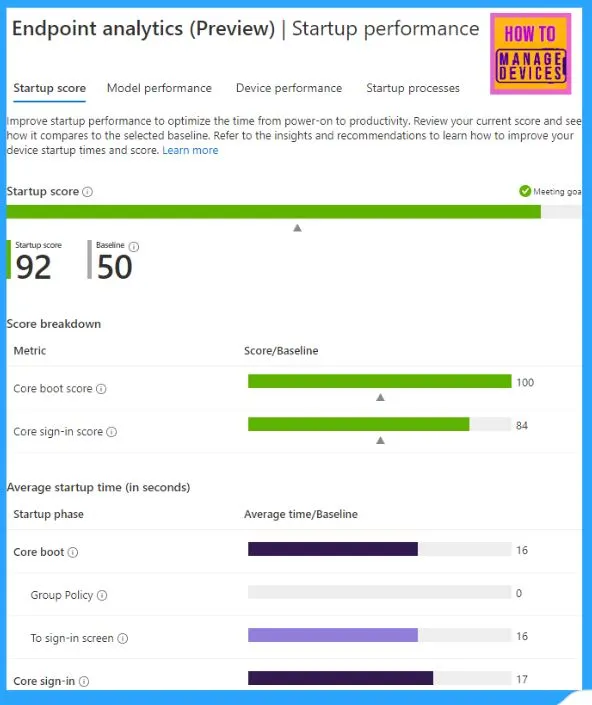
This is a great insight into the end-user experience. You can see how the devices perform (boot performance) and which startup processes affect their performance. Suppose your IT landscape includes devices from multiple OEM vendors or different models from the same OEM vendor. In that case, you can compare the model performances to help you make your next procurement decisions.
Note: At least 10 devices must send their boot performance records for the service to generate the startup processes impact report.
For devices that use corp-net and connect to the Internet via proxy or firewall, ensure the device can communicate to https://*.events.data.microsoft.com to send the analytics data.
However, like me, most of the IT Admins would be particularly interested in Endpoint Analytics for its Proactive Remediation feature.
Proactive Remediations – MEM Endpoint Analytics
This is an attempt from Microsoft to help shift the IT focus to proactive support rather than reactive support to mitigate issues before end-users actually begin to notice them and make an IT support call.
Check all the pre-requisites as stated by Microsoft here.
Long story short, it allows you to create a script package to be run on the endpoints to detect and automatically fix issues, thereby improving end-user experience and also helping to reduce IT support calls.
The feature allows you to run a PowerShell script as a Detection script, based on the output of which you can trigger another PowerShell script as a Remediation script.
You might have already guessed that since it involves running scripts on the endpoint, it essentially leverages the Intune Management Extension (aka Sidecar Agent) for the purpose.
Microsoft already provides a few built-in script packages for known issues, such as Group Policy refresh and restart Office C2R service, which can be readily deployed for proactive remediations on Windows 10 endpoints. Microsoft may add more such built-in script packages to address known issues.
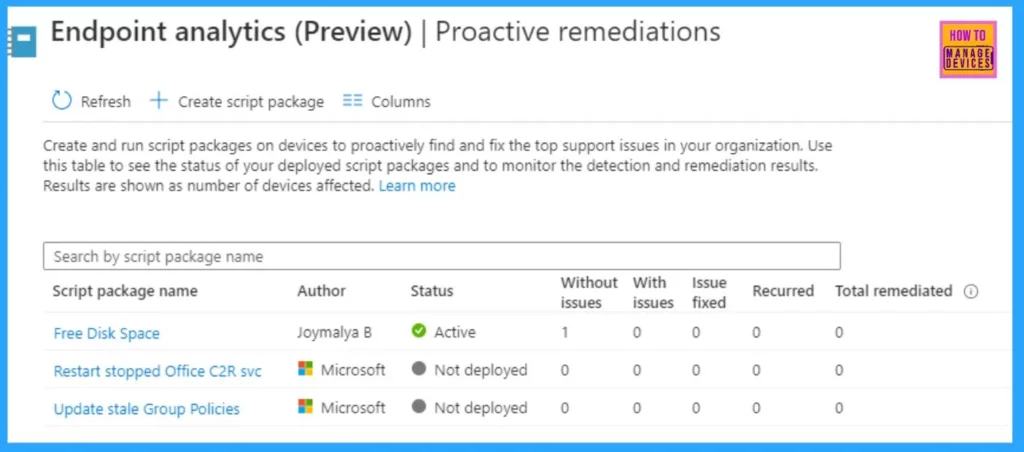
However, you can also easily create your own script packages to address issues that might be particular to your organization. You know it generates a lot of IT support calls, and it also knows that such issues reoccur at regular intervals and can be addressed via a script.
Creating a Custom Proactive Remediation Script Package – Step-by-Step Guide | MEM Endpoint Analytics
Considering you have already enabled Endpoint Analytics for your tenant and have devices onboarded.
- Navigate to Reports > Endpoint Analytics (preview) > Proactive remediations in the MEM portal.
- Click to Create a script package.

Configure the Name, Description, and Publisher information and click on Next.
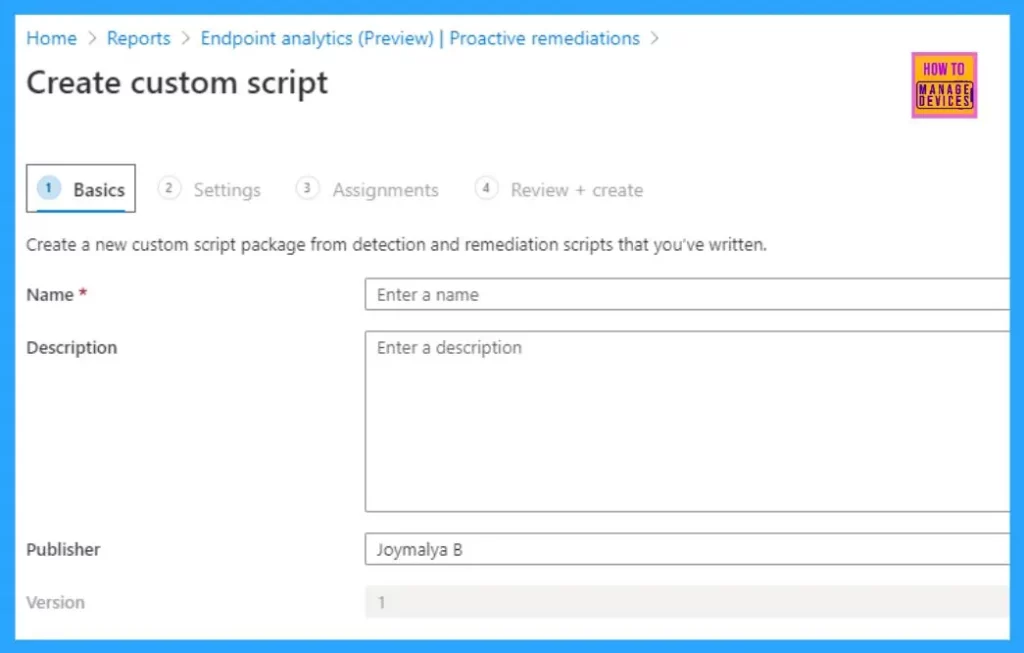
Create a customer script package from scripts you’ve written. By default, scripts will run assigned devices every day.
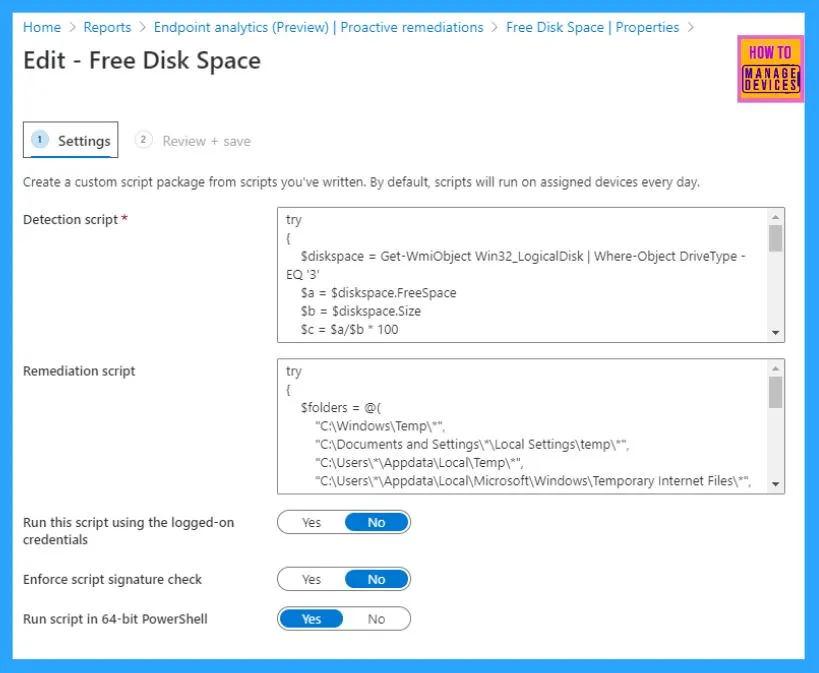
This is the main screen where all the action will be scripted – defining the script and its run parameters.
NOTE: If you only create a Detection script without any Remediation script, it will only detect and report.
The logic behind the script as of the date of writing is fairly simple.
Disclaimer! I am no expert in PS scripting, but the script below is just for demonstration and understanding purposes.
The Detection script should be written in a way like below
Detect and save value in a variable

If (variable matches condition)
{
Exit 1
}
else
{
Exit 0
}
If the Detection script exists with an Exit status 1, it will only signal Intune that the Remediation script should run. If the Detection script exists with Exit status 0, the Remediation script will not be triggered.
Based on the same logic, I prepared a Detection script to detect the remaining free disk space of an endpoint, setting the match condition to 25
Try
{
    $diskspace = Get-WmiObject Win32_LogicalDisk
    $a = $diskspace.FreeSpace
    $b = $diskspace.Size
    $c = $a/$b * 100
    $percfree = [Math]::Round($c)

    if (($percfree -le 25)){
        #Below necessary for Intune as remediation triggered for Exit Code 1 only
        Write-Host "Match"
        Return $percfree
        exit 1
    }
    else
   {
        Write-Host "No_Match"
        exit 0
    }
}
catch
{
    $errMsg = $_.Exception.Message
    Write-Error $errMsg
    exit 1
}
If the script detects that the remaining free space on an endpoint’s disk is below 25% (which means it exits with status 1), it will trigger the Remediation script, which will do the cleanup, deleting temporary and junk contents to free up disk space.
try
{
    $folders = @(
        "C:\Windows\Temp\*",
        "C:\Documents and Settings\*\Local Settings\temp\*",
        "C:\Users\*\Appdata\Local\Temp\*",
        "C:\Users\*\Appdata\Local\Microsoft\Windows\Temporary Internet Files\*",
        "C:\Windows\Temp",
        "C:\Windows\prefetch")

        foreach ($folder in $folders)
        {
        Remove-Item $folder -force -recurse -ErrorAction SilentlyContinue
        }
    exit 0
}
catch
{
    $errMsg = $_.Exception.Message
    Write-Error $errMsg
    exit 1
}
As I already said, I am no scripting expert, so the above is a pretty basic script with which I have created my custom script package.
- Once this part is done, click on Next and plan your Assignments for the same.
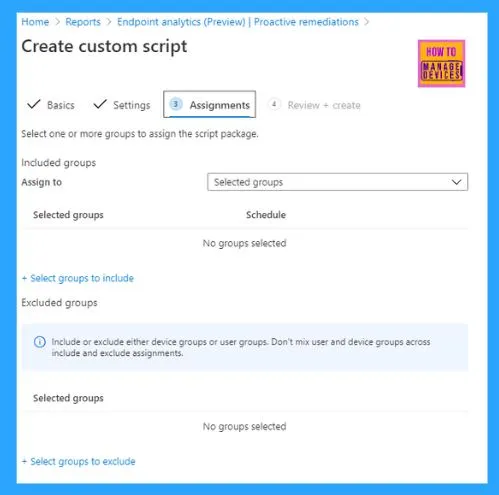
While creating the Assignment, you can set the Scheduling options for the script package to determine the frequency of script run.
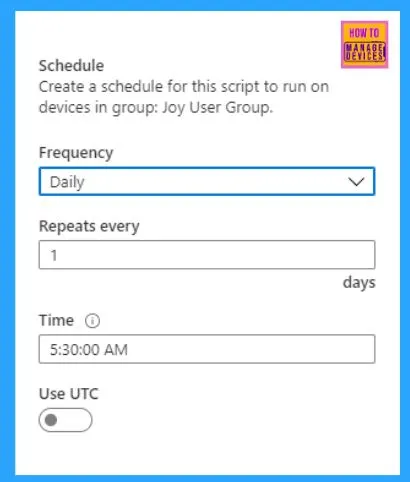
Once you have made the active assignment, all is done.
Monitoring Status– MEM Endpoint Analytics
Like with all other workloads, you get status monitoring to check the stats of MEM Endpoint Analytics (currently in public preview).
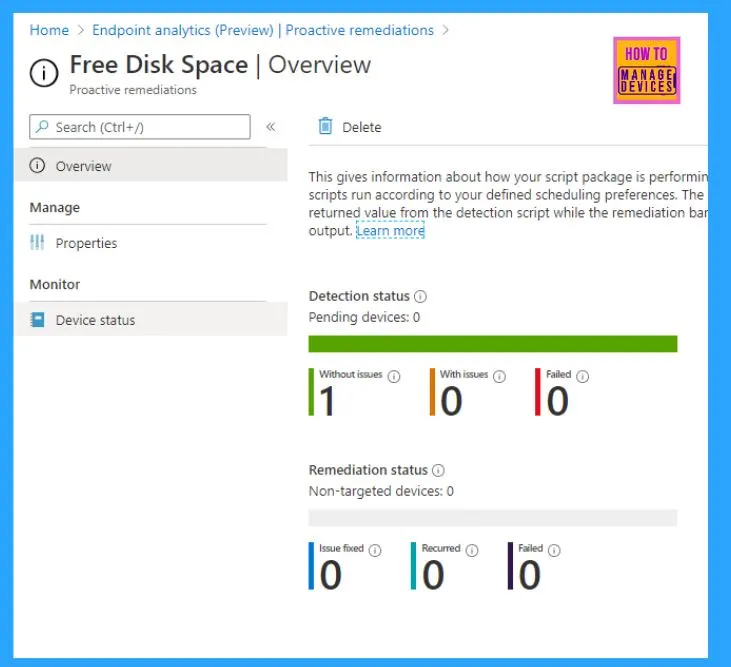
The Overview blade gives the number of devices detected with or without issues and the count of devices where the script failed. If a remediation script is included in the package, it will also give the status for remediation.
You can further drill down per device based on the Device status under Monitor.
Device End Implementation via Intune Management Extension –MEM Endpoint Analytics
NOTE: MEM Endpoint Analytics is still in public preview and, as such, is subject to changes made by Microsoft.
Startup Performance
Previously, if you have noticed, Intune Management Extension logs only gave us
- ClientHealth.log
- AgentExecutor.log
- IntuneManagementExtension.log
Log location C:\ProgramData\Microsoft\IntuneManagementExtension\Logs
Now you will see a new log named Sensor.log in the same location, which gives you details about the boot performance data collection. If you go through the log, you will find that it utilizes the location C: WindowsSensorFramework, from where the boot performance monitoring SensorFramework is initialized, monitoring the performance status.
The performance monitoring, as can be seen from the logs, is facilitated via the ETW trace.
Ref log entries

<![LOG[[datasensor] IME ETW provider id is 2aff61a4-4c35-502c-190b-32283cff3ac0, event type is Microsoft.Management.Clients.IntuneManagementExtension.DataSensorPlugIn.Contracts.IntuneManagementExtensionProvider, enrollmentTime: 7/8/2020 2:26:09 AM, ConfigDeviceHealthMonitoringScope: BootPerformance]LOG]!>
The two entries in the log below confirm that the IME has successfully registered the sensor to monitor the boot and logon performance data.
<![LOG[[datasensor] successfully registered the datasensor for BootData, readExisingEvents=True]LOG]!>
<![LOG[[datasensor] successfully registered the datasensor for LogOnPerfData, readExisingEvents=True]LOG]!>
Related registry that I found
HKEY_LOCAL_MACHINE\SOFTWARE\Microsoft\IntuneManagementExtension\sensor\bootdata
HKEY_LOCAL_MACHINE\SOFTWARE\Microsoft\IntuneManagementExtension\sensor\logondata
I think the bookmark reg_key under the above reg_path holds the current trace session (or ID), which the sensor evaluates to provide feedback to the service.
The related Graph API resource type being used in the backend is windowsHealthMonitoringConfiguration which is under the beta endpoint as of now.
Proactive Remediations
Normal PowerShell policies are tracked in the IME under the registry below reg_path
HKEY_LOCAL_MACHINE\SOFTWARE\Microsoft\IntuneManagementExtension\Policies
HealthScripts, I believe, are tracked in the IME registry under below reg_path as per my lab testings
HKEY_LOCAL_MACHINE\SOFTWARE\Microsoft\IntuneManagementExtension\SideCarPolicies\Scripts
The relevant activities are listed in the IME log with the identifier [HS], which refers to HealthScripts.
The graph API resource type in use is named deviceHealthScripts and is under beta endpoint as of now.
As per my log findings, IME handles the HealthScripts in two parts –
- Scheduler – responsible for polling service to retrieve script packages as configured and set the scheduling
- Runner – execution of the script package as per the schedule invoking the agent executor
Log reference (IME Logs)
<![LOG[[HS] Request health script check in for user logon.]LOG]!>
<![LOG[[HS] Scheduler -------------------------- Scheduler starts. ------------------------------- ]LOG]!>
<![LOG[[HS] Get 2 active user sessions]LOG]!>
<![LOG[starting impersonation, session id = 1]LOG]!>
<![LOG[After impersonation: AzureAD\JoymalyaB]LOG]!>
<![LOG[Successfully get the token with client id fc0f3af4-xxx5-4174-b806-f7db311fd2f3 and resource id 26a4ae64-5862-427f-a9b0-04xxxxx2a4f]LOG]!>
<![LOG[[HS] Total valid AAD User session count is 1]LOG]!>
<![LOG[[HS] Requesting health scripts with session id e920f6c8-20ef-498a-86ee-54ff473f6f9b ...]LOG]!>
<![LOG[[HS] Got 1 script(s) for user 7dc9e7f5-bcd7-4f64-8050-b3a9c0df090b in session 2]LOG]!>
<![LOG[[HS] start ProcessResolvedPolicies]LOG]!>
<![LOG[[HS] hasNoUserLogOn = False]LOG]!>
<![LOG[[HS] finish ProcessResolvedPolicies, resolved policy count is 1]LOG]!>
<![LOG[[HS] Scheduler ..................... Scheduler completed user session 2, userId: 7dc9e7f5-bcd7-4f64-8050-b3a9c0df090b, userSID:  ..................... ]LOG]!>
<![LOG[[HS] inspect daily schedule for policy 0e3a2b22-1801-46a9-8888-982aa7887d88, UTC = False, Interval = 1, Time = ]LOG]!>
<![LOG[[HS] Calcuated earliest time is 7/8/2020 10:25:27 AM]LOG]!><time="03:20:27.2999756" date="7-8-2020" component="IntuneManagementExtension" context="" type="1" thread="12" file="">
<![LOG[[HS] Scheduler : Job is queued and will be scheduled to run at UTC 7/8/2020 10:25:27 AM.]LOG]!>
<![LOG[[HS] Scheduler ----------------------- policy poller stopped. -------------------------------- ]LOG]!>
Log reference for the Runner part, followed by the Scheduler part.
<![LOG[[HS] Runner------------------------ Runner starts. ----------------------------- ]LOG]!>
<![LOG[[HS] start ProcessResolvedPolicies]LOG]!>
<![LOG[[HS] hasNoUserLogOn = False]LOG]!>
<![LOG[[HS] finish ProcessResolvedPolicies, resolved policy count is 1]LOG]!>
<![LOG[[HS] Created Health script folder]LOG]!>
<![LOG[[HS] inspect daily schedule for policy 0e3a2b22-1801-46a9-8888-982aa7887d88, UTC = False, Interval = 1, Time = ]LOG]!>
<![LOG[[HS] Runner: script 0e3a2b22-1801-46a9-8888-982aa7887d88 will be executed now.]LOG]!>
<![LOG[[HS] Create output files successfully.]LOG]!>
<![LOG[[HS] ACL output files successfully]LOG]!>
<![LOG[[HS] Processing policy with id = 0e3a2b22-1801-46a9-xxx8-982aa7887d88]LOG]!>
<![LOG[[HS] The policy needs be run as System]LOG]!>
<![LOG[[HS]: Enforce signature check = False, Running mode = 1]LOG]!>
<![LOG["C:\Program Files (x86)\Microsoft Intune Management Extension\agentexecutor.exe"  -remediationScript  ""C:\Windows\IMECache\HealthScripts\0e3a2b22-1801-46a9-8888-982aa7887d88_1\detect.ps1"" ""C:\Windows\IMECache\HealthScripts\0e3a2b22-1801-46a9-8888-982aa7887d88_1\663d0515-3268-4651-b140-fbb2f30d8ed4_PreDetectScript.output"" ""C:\Windows\IMECache\HealthScripts\0e3a2b22-1801-46a9-8888-982aa7887d88_1\663d0515-3268-4651-b140-fbb2f30d8ed4_PreDetectScript.error"" ""C:\Windows\IMECache\HealthScripts\0e3a2b22-1801-46a9-xxx8-982aa7887d88_1\663d0515-3268-4651-b140-fbb2f30d8ed4_PreDetectScript.timeout"" 3600 "C:\Windows\System32\WindowsPowerShell\v1.0" 0 ""C:\Windows\IMECache\HealthScripts\0e3a2b22-1801-46a9-8888-982aa7887d88_1\663d0515-3268-4651-b140-fbb2f30d8ed4_PreDetectScript.exit"" False ""]LOG]!>
<![LOG[Launch powershell executor in machine session]LOG]!>
<![LOG[process id = 6024]LOG]!><time="03:25:32.4300226" date="7-8-2020" component="IntuneManagementExtension" context="" type="1" thread="4" file="">
<![LOG[Powershell execution is done, exitCode = 0]LOG]!>
<![LOG[[HS] Returned exitcode from child process is 0]LOG]!>
<![LOG[[HS] exit code of the script is 0]LOG]!>
<![LOG[[HS] There is no compliance rule defined for the script.]LOG]!>
<![LOG[[HS] the pre-remdiation detection script compliance result for 0e3a2b22-1801-46a9-8888-982aa7887d88 is True]LOG]!>
<![LOG[[HS] new reuslt = {"PolicyId":"0e3a2b22-1801-46a9-8888-982aa7887d88","UserId":"7dc9e7f5-bcd7-4f64-8050-b3a9c0df090b","PolicyHash":null,"Result":3,"ResultDetails":null,"InternalVersion":1,"ErrorCode":0,"ResultType":1,"PreRemediationDetectScriptOutput":"86","PreRemediationDetectScriptError":null,"RemediationScriptErrorDetails":null,"PostRemediationDetectScriptOutput":null,"PostRemediationDetectScriptError":null,"RemediationStatus":4,"Info":{"RemediationExitCode":0,"FirstDetectExitCode":0,"LastDetectExitCode":0,"ErrorDetails":null}}]LOG]!>
<![LOG[[HS] Saving policy results for user: 7dc9e7f5-bcd7-4f64-8050-b3a9c0df090b]LOG]!>
<![LOG[[HS] starting to send report]LOG]!>
<![LOG[[HS] sending results to service..]LOG]!>
<![LOG[[HS]Policy results are successfully sent.]LOG]!>
<![LOG[[HS] inspect daily schedule for policy 0e3a2b22-1801-46a9-8888-982aa7887d88, UTC = False, Interval = 1, Time = ]LOG]!>
<![LOG[[HS] Runner : queued time : 7/8/2020 10:25:27 AM is expired.., clear the queue]LOG]!>
<![LOG[[HS] Runner : Job is queued and will be scheduled to run at UTC 7/9/2020 10:25:38 AM.]LOG]!>
<![LOG[[HS] Runner---------------------------- policy poller stopped. ------------------------------ ]LOG]!>
Like normal PowerShell scripts are handled, IME invokes the Agent Executor to trigger the execution of the PS script.
<![LOG[remediation script option gets invoked]LOG]!>
<![LOG[C:\Windows\IMECache\HealthScripts\0e3a2b22-1801-46a9-8888-982aa7887d88_1\detect.ps1]LOG]!>
<![LOG[Prepare to run Powershell Script ..]LOG]!>
<![LOG[cmd line for running powershell is -executionPolicy bypass -file  "C:\Windows\IMECache\HealthScripts\0e3a2b22-1801-46a9-8888-982aa7887d88_1\detect.ps1" ]LOG]!>
<![LOG[runAs32BitOn64 = False, so Disable Wow64FsRedirection]LOG]!>
<![LOG[PowerShell path is C:\Windows\System32\WindowsPowerShell\v1.0\powershell.exe]LOG]!><![LOG[[Executor] created powershell with process id 1264]LOG]!>
<![LOG[Powershell exit code is 0]LOG]!>
<![LOG[Powershell script is successfully executed.]LOG]!>
As you can see, since the detection script is exiting with exit code 0, hence the remediation script is not being triggered.
Unlike PowerShell script deployments from Intune, which are one-time executions by default and by design, HealthScripts will be processed for re-execution as per the configured schedule. You can see the script’s next run time in the above log references.
The scripts remain on the endpoint at the location C:\Windows\IMECache\HealthScripts

The End
The capability to write a custom detection script and have it trigger a subsequent remediation script opens up a whole new world of proactive measures that you can take as an IT admin to make IT support’s life easier and help improve the end-user experience. As I stated, I am not a scripting expert, but if you have the required skills, you will surely be enticed by this new feature.
Do check out my other blogs on MEM Intune here.
Stay safe, and happy testing to all!
We are on WhatsApp. To get the latest step-by-step guides and news updates, Join our Channel. Click here –HTMD WhatsApp.
Author
Joymalya Basu Roy is an experienced IT service professional with almost 5 years of experience working with Microsft Intune. He is currently working as a Senior Consultant – Architect with Atos India. He is an ex-MSFT, where he worked as a Premiere Support Engineer for Microsoft Intune. He was also associated with Wipro and TCS in the early stages of his career. He was awarded the Microsoft MVP award for Enterprise Mobility in 2021. You can find all his latest posts on his own blog site MDM Tech Space at https://joymalya.com



Your first sample script has the exit codes backwards.
Detect and save value in a variable
should be:
If (variable matches condition)
{
Exit 0
}
else
{
Exit 1
}
Thank you for using my name from Texas ❤️
The Match condition exit code should be 1 for the Detect script in order for intune to trigger the Remediation script. The exit codes in the remediation scripts are then for either success (0) or fail (1).