Let’s have a quick look in Windows 365 Cloud PC Performance report from Intune. The Cloud PC connection quality report and utilization report helps you evaluate Cloud PC users experiences.
The Cloud PC connection quality report helps you evaluate Cloud PC users’ connection experiences. You can check reports for individual Cloud PCs and aggregated report for all the Cloud PCs with connectivity details in one place.
Cloud PC utilization on the Cloud PC performance page is an optimization tool that enables admins to identify devices with low utilization and take actions to either deprovision, reallocate to new users, or downsize Cloud PCs.
Cloud PC health monitoring reports provide better sizing analysis for your virtual desktops. The Cloud PC health and performance monitoring feature comes without any additional agent deployment. This uses Intune Management Extension (IME) agent to collect the data.
- Cloud PC Connectivity Errors Report From Intune
- Cloud PC Health Performance Monitoring Using Endpoint Analytics using Intune
Windows 365 Cloud PC Performance Report
Performance checks are run against individual Cloud PCs and tell you whether a Cloud PC is in a healthy and connectable state. These checks can be accessed through the new Cloud PC Performance (preview) tab under the device overview blade.
- The first step is to sign in to the Intune admin center https://endpoint.microsoft.com/
- Select Devices > Overview > Cloud PC performance (preview).
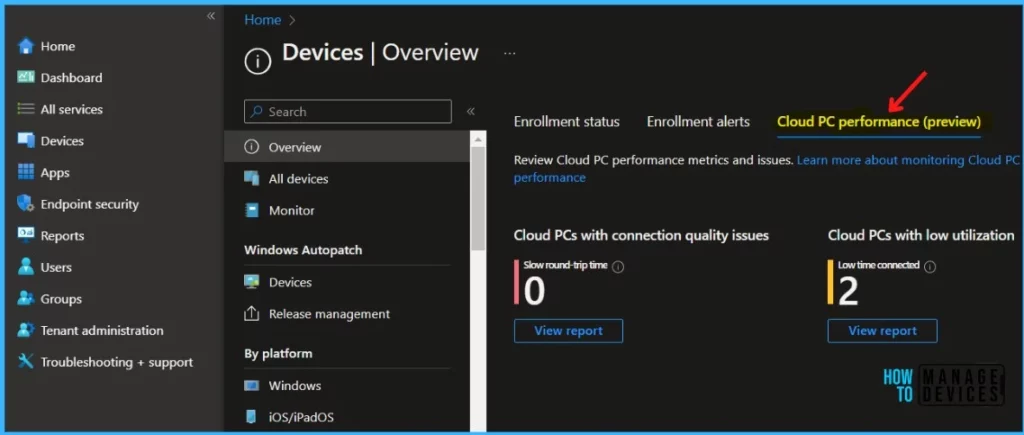
In the Cloud PC performance tab, you can review Cloud PC performance metrics and issues.
- Cloud PCs with connection quality issues – The Cloud PC connection quality report helps you evaluate Cloud PC users’ connection experiences.
- Cloud PCs with low utilization – The Cloud PC utilization report helps you make sure that your licenses are assigned to active users.
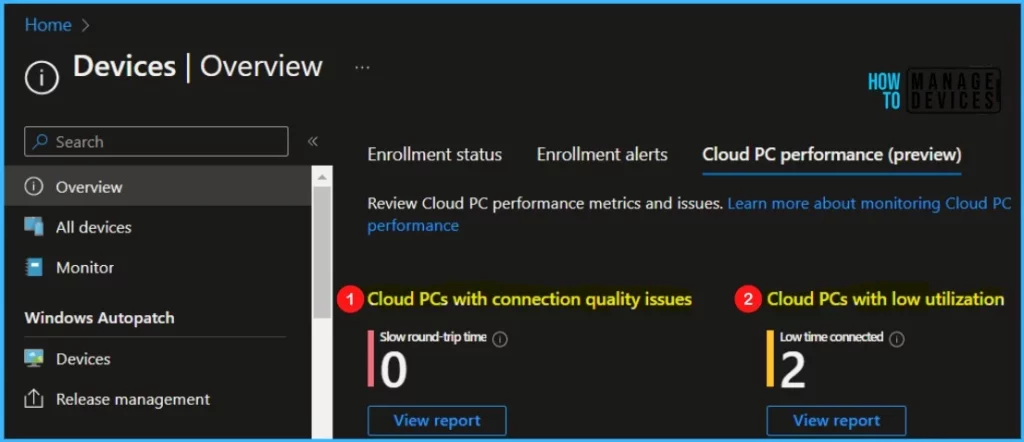
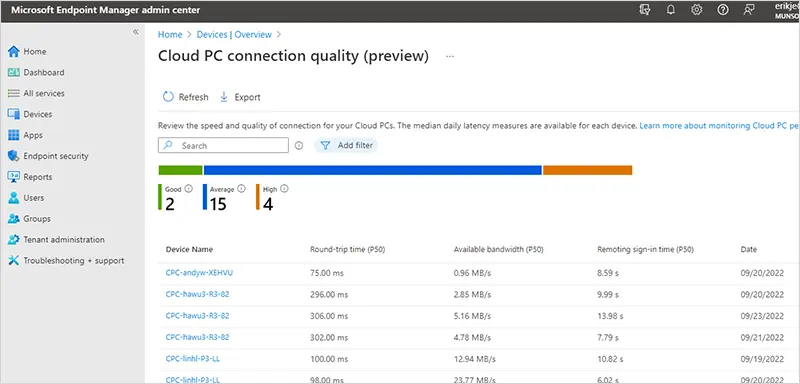
To get to the Cloud PC connection quality report, Click on View report (under Cloud PCs with connectivity quality issues).
The histogram shows aggregated round-trip times of all the Cloud PCs in your tenant. The round-trip time is how many milliseconds it took to connect to the Cloud PC.
- Good: Less than 100 milliseconds.
- Average: 100-200 milliseconds.
- High: More than 200 milliseconds.
Review the speed and quality of connection for your Cloud PCs. The median daily latency measures are available for each device, The device list shows the individual Cloud PCs with the following columns:
- Device name
- Round-trip time (P50) (RTT): The number of milliseconds it took to establish the user connection to the Cloud PC. Lower values indicate better round-trip connectivity.
- Available bandwidth (P50): Internet bandwidth during the user’s attempt to connect to their Cloud PC.
- Remoting sign-in time (P50): The number of seconds it took the user to complete the sign-in process.
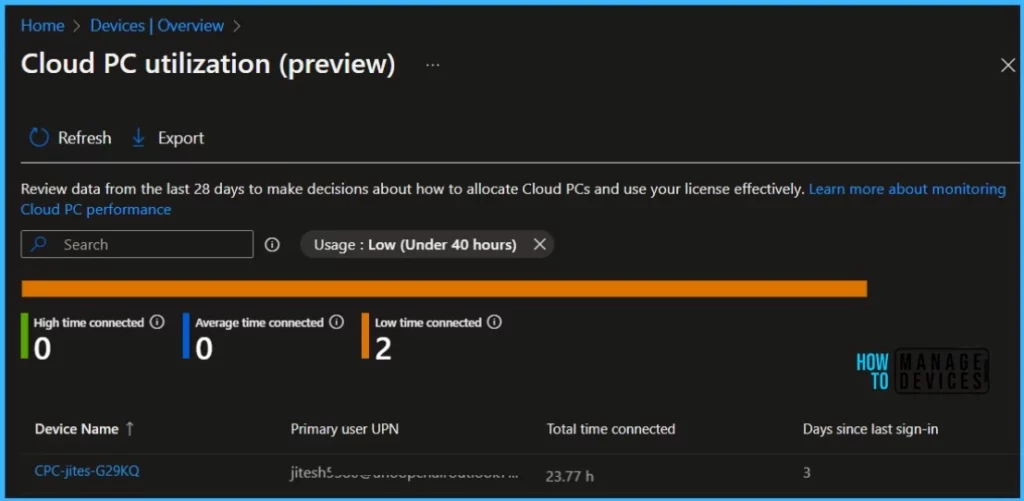
To get to the Cloud PC utilization report, Once you clicked on View report (under Cloud PCs with low utilization), you will get the additional details for assigned Windows 365 Cloud PC in your tenant.
By reviewing Cloud PCs with low usage, you can decide if a Windows 365 license would better serve other users who might use these resources more often.
Review data from the last 28 days to make decisions about how to allocate Cloud PCs and use your license effectively, The report shows the following data aggregated for the last 28 days:
- This histogram shows user connection time in three sections:
- High time connected: More than 80 hours.
- Average time connected: 40-80 hours.
- Low time connected: Less than 40 hours.
- List of individual Cloud PCs with the following columns:
- Device name
- Primary user UPN
- Total time connected: The total hours that the user has been connected to the Cloud PC over the last 28 days.
- Days since last sign in
Windows 365 Cloud PC Performance Report
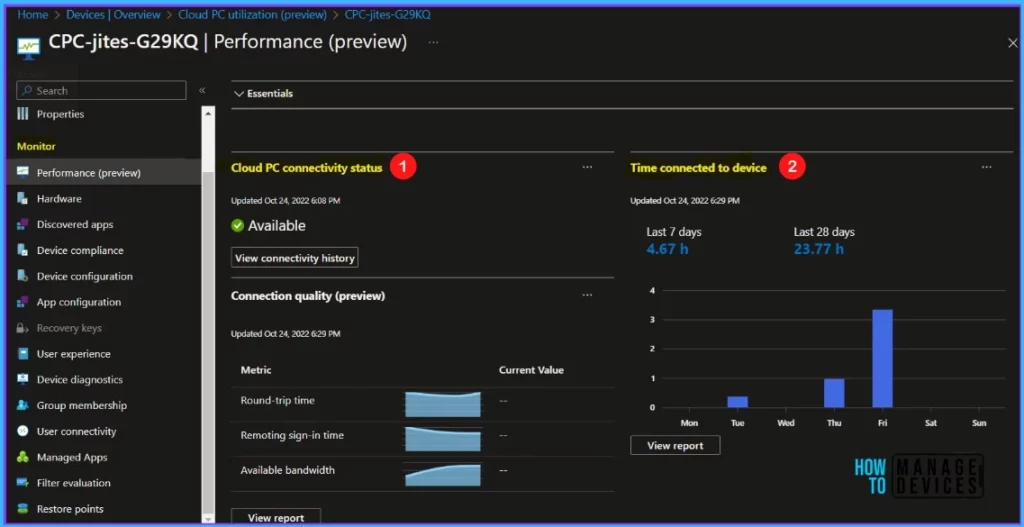
You can see similar connectivity quality data, Time connected to device and connectivity history on a per-Cloud PC basis. Here’s how let’s follow the steps below to check more detailed Cloud PC performance report.
- Sign in to Intune admin center https://endpoint.microsoft.com/ > Devices > All Devices.
- Select Cloud PC and then under Monitor, select Performance (preview).
Connectivity quality – Here you will see Connection quality (preview). Under this chart, select View report to see more connection data specific to this Cloud PC.
Time connected to device – Here you will see Time connected to device. Under this chart, select View report to see more utilization data specific to this Cloud PC.
The Cloud PC Connectivity Errors Report from the MEM admin center is useful in troubleshooting. We have already shared how to configure the Cloud PC monitoring health check tool using Intune Endpoint Analytics. Here you can get more details for connectivity history that help you to perform troubleshoot.
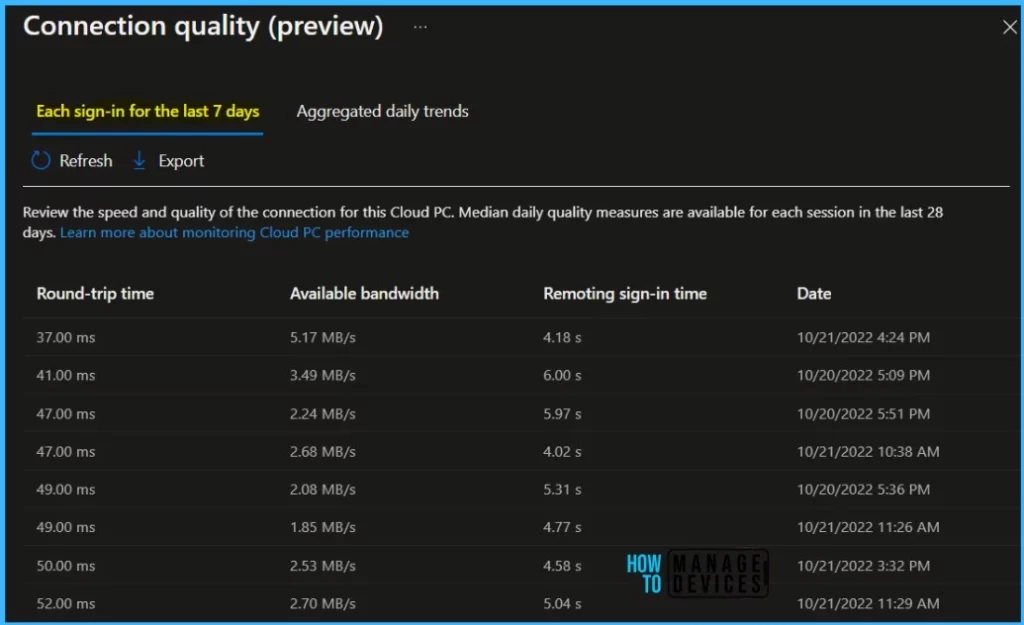
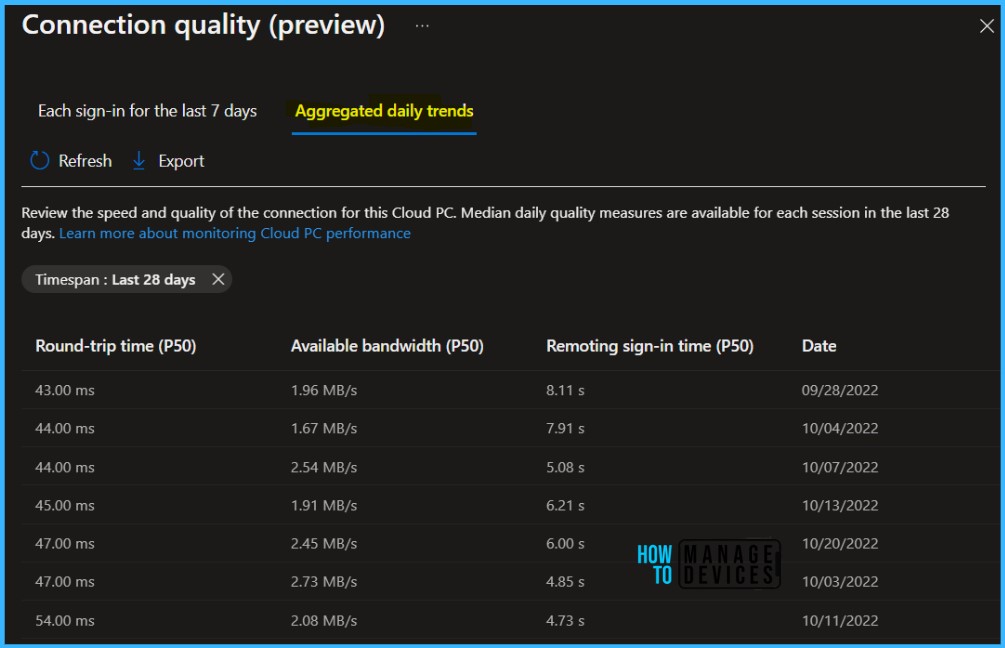
Review the speed and quality of the connection for this Cloud PC. Median daily quality measures are available for each session in the last 28 days. The device list shows the individual Cloud PCs with the following columns:
- Round-trip time (P50) (RTT): The number of milliseconds it took to establish the user connection to the Cloud PC. Lower values indicate better round-trip connectivity.
- Available bandwidth (P50): Internet bandwidth during the user’s attempt to connect to their Cloud PC.
- Remoting sign-in time (P50): The number of seconds it took the user to complete the sign-in process.
The histogram shows aggregated round-trip times of all the Cloud PCs in your tenant. The round-trip time is how many milliseconds it took to connect to the Cloud PC.
Windows 365 Cloud PC Usage Report
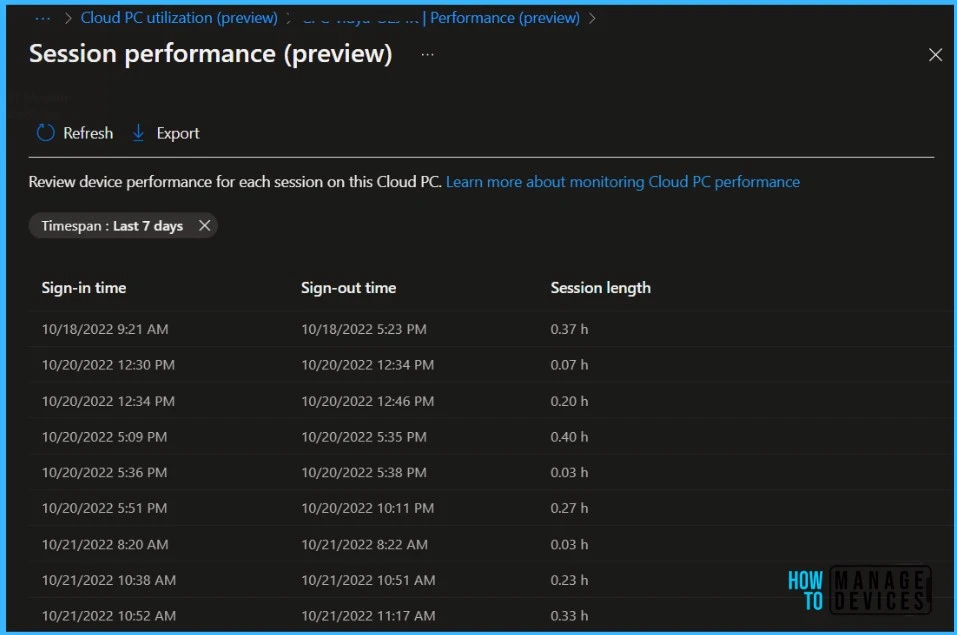
This report shows the device performance for each session on the selected Cloud PC, along with the details sign-in time, sign-out time and overall session length of the Cloud PC.
You can also use a PowerShell Script prepared by Donna Ryan, team to get a usage report for Windows 365 that includes the information about login count over a period and the last login date, let’s check the avaiable script from the Windows 365 Github Repo.
Note – This script requires the AzureADPreview module be installed. This module is not compatible with the AzureAD module. If the AzureAD module is installed, it must be removed prior to running this script.

Hello!
Is there anyway to access the “Days since last logon” data through Log Analytics?
Either using the PS Script from Donna or directly through Device Diagnostic outputs?
Hi Ryan, You can get the logged-in count from the X days and the Last logged in Time. I think that you were looking here..