Let’s Discuss Intune Anomaly Detection Device and Advanced Analytics. Microsoft has already shared detailed information about these security focused topics. The details are given in the latest Technical Takeoff session by Zineb Takafi.
Anomaly detection helps you find potential problems in a system before they escalate into a major issue. Using data and insights, IT admins can monitor and troubleshoot device issues with the help of Intune Advanced Analytics, which is a feature of the Microsoft Intune Suite.
You can view device correlation groups to detect anomalies and explore potential root causes for anomalies with medium and high severity. Intune Advanced Analytics is a very powerful tool, it will allow the user to get deep insights and make informed decisions.
Analytics capabilities are the feature, you can investigate anomalous behaviour by using correlating events and signals on your device. You can also slice endpoint analytics scores insight and subset devices with custom scope.
- Intune EPM Support Approve Scenario Explained
- 6 Exciting Features coming to Intune Enterprise App Management
- Deploy Windows Catalog App type using Intune Enterprise Application Catalog
Intune Anomaly Detection Device and Advanced Analytics
Zineb Takafi introduced a new anomaly detection device cohorts feature in the Technical Takeoff session. This feature will help you monitor health, user experience and productivity regressions. Also, you will get more visibility on hardware performance issues and impacts on battery life.
Anomaly Detection
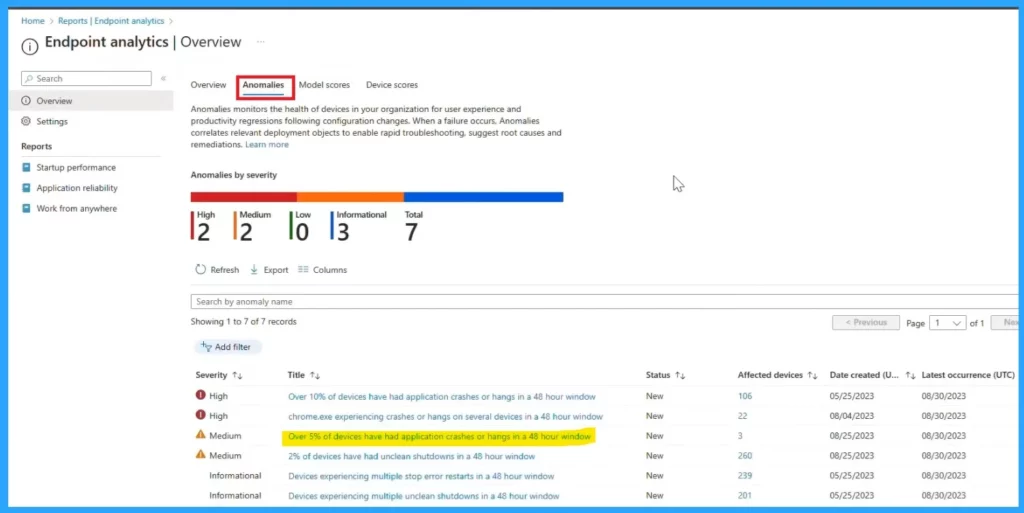
In the admin center on the Endpoint analytics. You can see the anomalies option there. You can click on that option. It shows only a high level of confidence based on severity level.
There are 4 levels of anomaly severity: high level, medium level, low level, and informational. In this window, you can see the list of all those anomalies on a tenant base.
- Click on any Severity
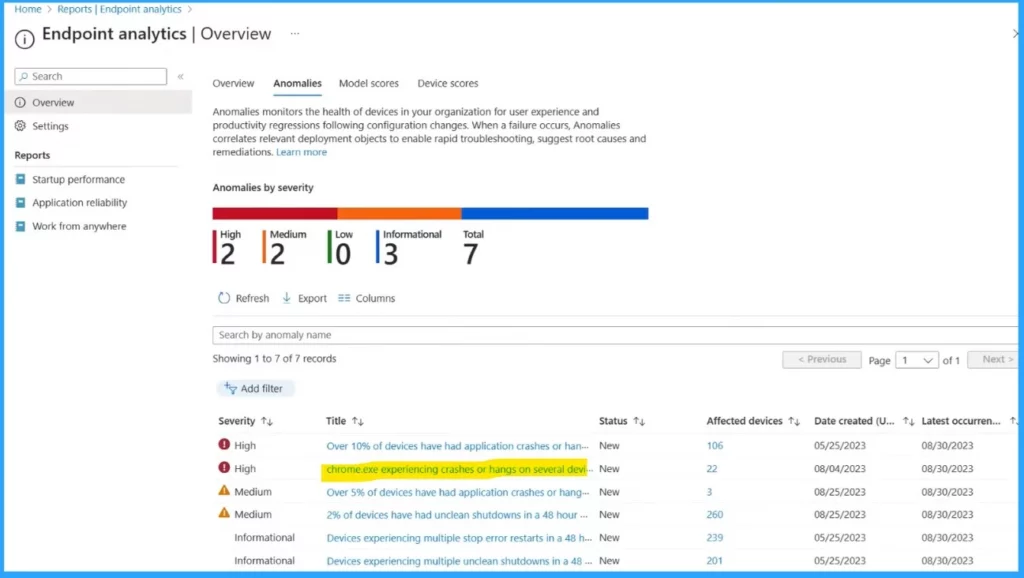
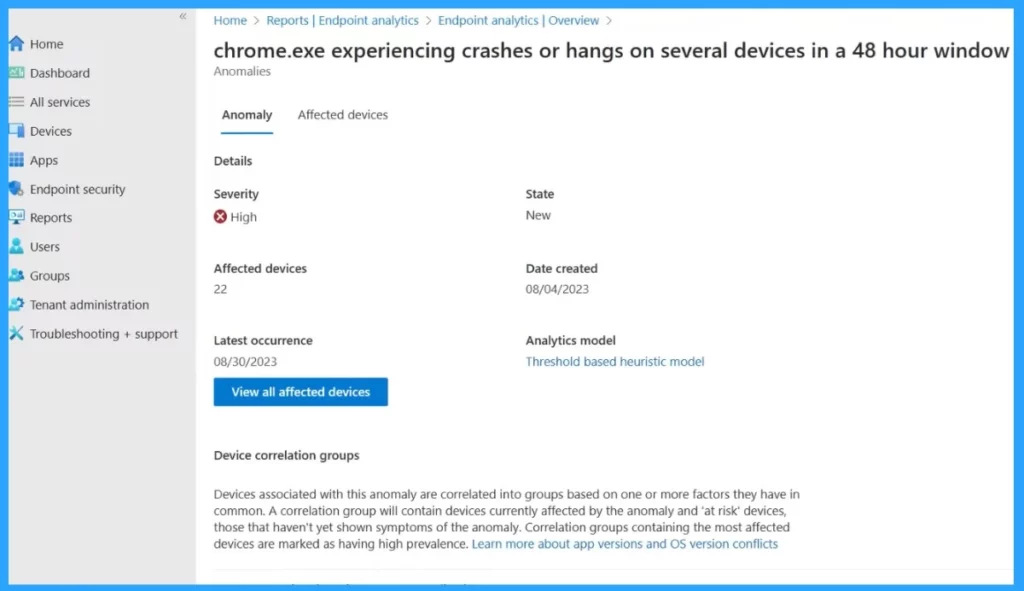
Click on one of those anomalies you saw in the above window. And you will get more information about that specific anomaly. This is the high-level severity of chrome.exe experiencing crashes or hangs on several devices in a 48-hour window.
In the state option, you can see if there is a new or active anomaly and the number of affected devices, the date created, and the latest occurrence of this specific anomaly. In this information window, you can also get the. Correlation group (Device cohorts)
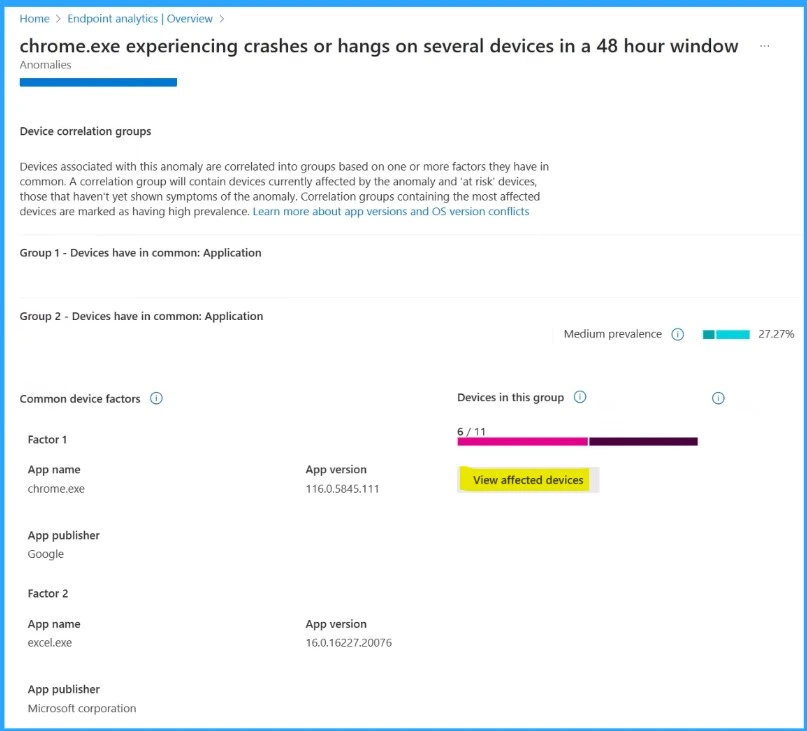
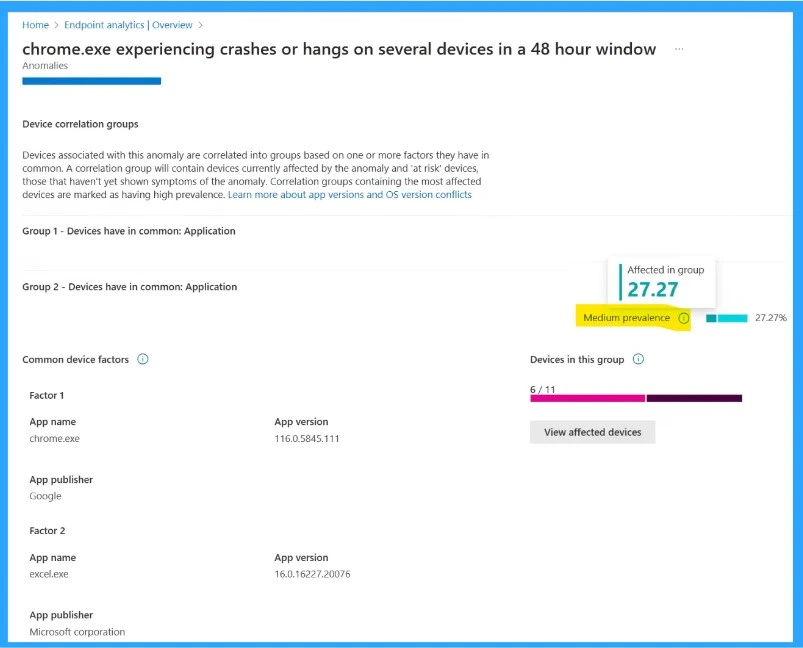
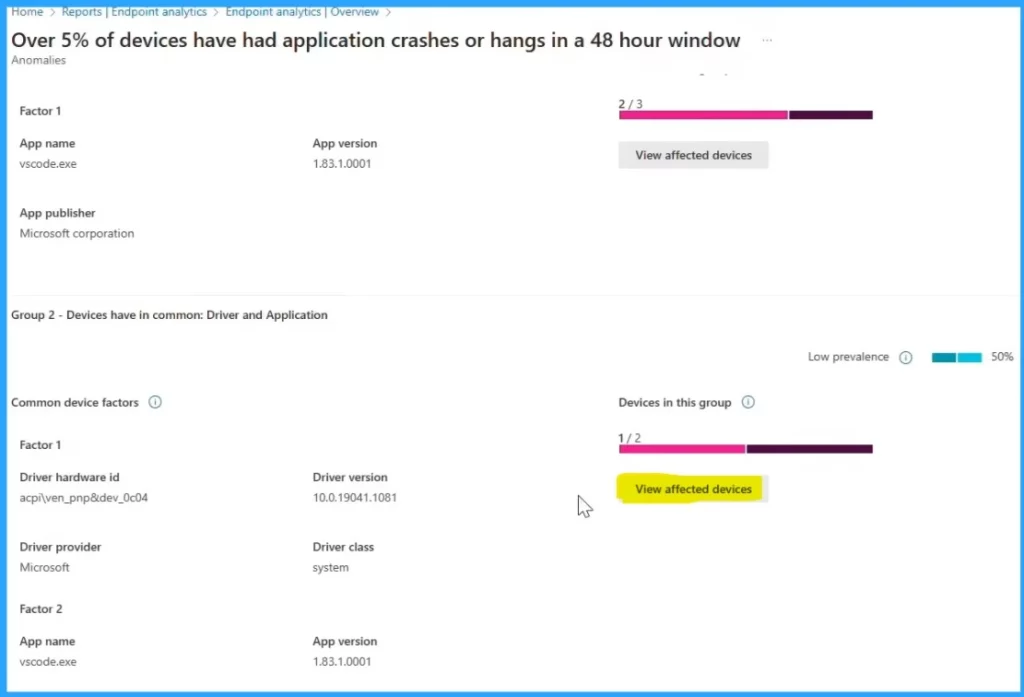
If you click on one of any correction groups, you can see all the devices associated with this anomaly. This is correlated into groups based on one or more factors. There are 2 app factors on specific app versions. Here, you can find the affected and at-risk devices.
Clicking on the at-risk device using the metric will give a sense of how big the anomaly would become. These devices have no anomaly, but they have a high level of chance of being affected.
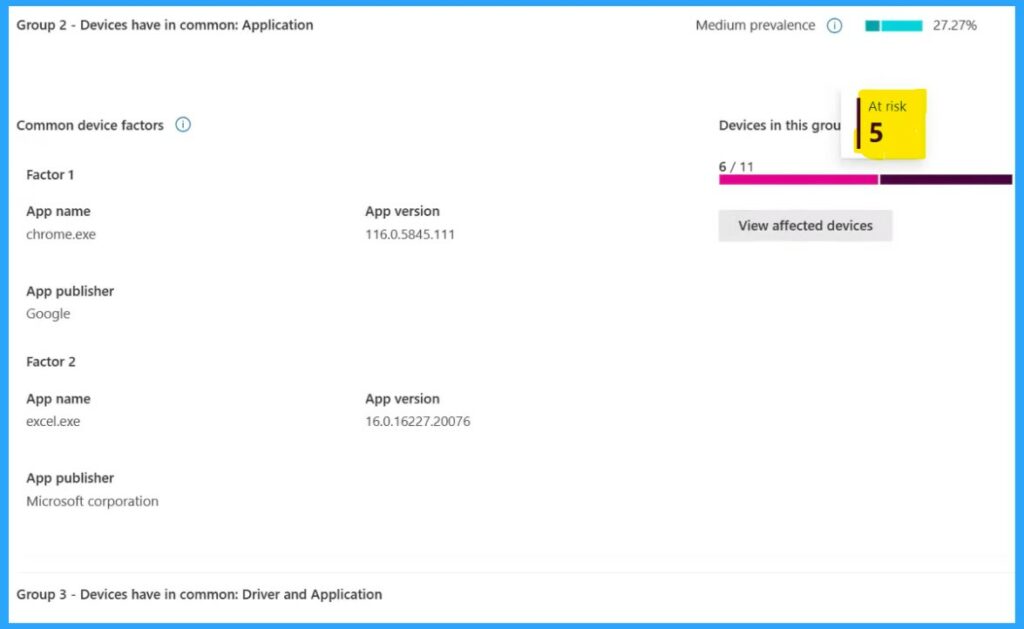
in the prevalence that is used to indicate how strongly these attributes define the cohorts that correlate with the anomaly detected. Here 27.27 %of devices are affected by this anomaly.
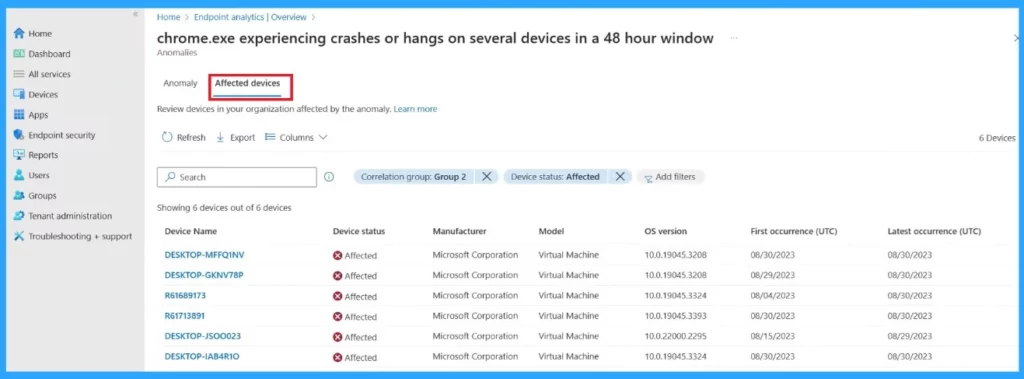
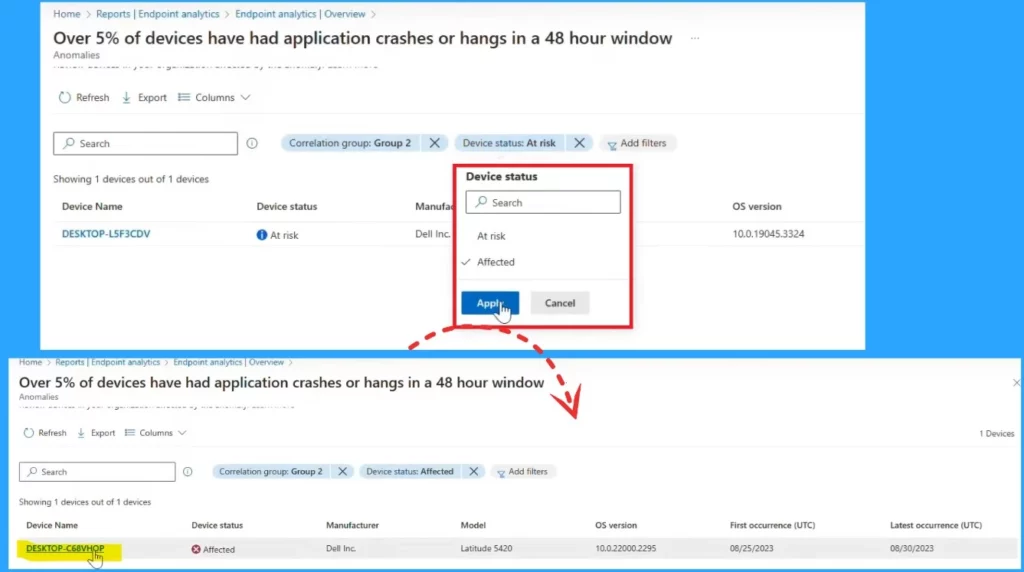
If you click on the affected devices, you are able to see and review all the devices in your organisation that are affected by this anomaly. You can also filter this correlation group and device status to determine whether that is affected or at risk.
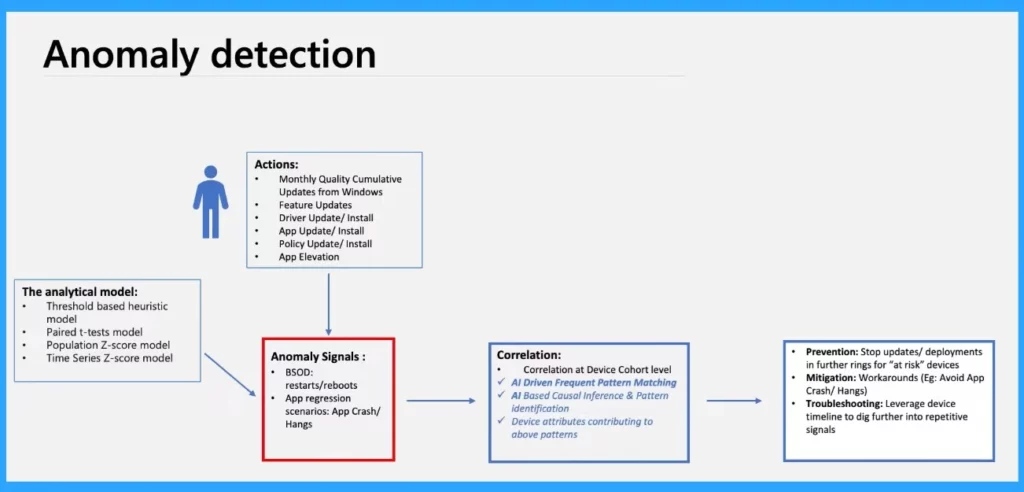
Intune advanced analytics comprises 2scenarios: progression scenario and desktop errors and restarts scenario. Intune Advanced Analytics uses 4 statistical models to identify these categories.
These models set thresholds to determine anomalies or calculate z-score boards and look at data points that fall outside of certain ranges. These analytical models consider which devices will have anomalies and are at risk.
| Scenarios | Used to |
|---|---|
| Progression scenario | The progression scenario includes app crashes and app hangs |
| Desktop errors and restarts scenario | desktop errors and restarts scenario covers desktop errors and restarts |
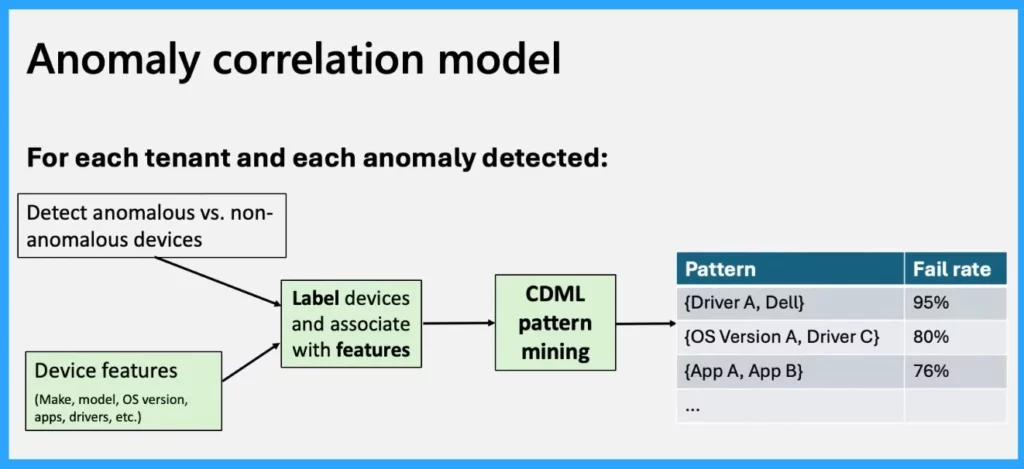
Anomaly Correlation Model
This algorithm operates for analysing those anomalous and non–anomalous devices and their associated data and then displays the top four or five patterns of high-level confidence (cohorts).
The device cohorts will show those recurring patterns and relationships of anomalies. This will help you to provide invaluable insights into root causes and solutions.
This Tenant has some anomalies, they are classified into high, medium, low, and information levels. This one is a device cohort anomaly with a medium severity. It shows the state and the number of devices that are affected by anomalies.
- Click on the Anomalies
- Click on any Severity
After that, you will get a window where you can click on affected devices; here, you will get all the information about app versions, driver versions, etc.
- Click on the View Affected Devices
In another window, you can filter down to see the at-risk and affected devices for this specific anomaly. and you can apply any of them. Here filter with the option affected, and you will get the affected device.
If you pick one of those affected devices, you will get the other window where you can use very powerful queries. For that, click on more options first and Click on the Intune Pivot.

In the query section, run a query for this specific app-based scenario. Run the Intune Pivot query, and then you can see the app version and all those details here. So you can see that an older version for that specific app probably missed the quality update.

Video – Advanced analytics: supercharge real-time reporting with insights that matter
We are on WhatsApp. To get the latest step-by-step guides and news updates, Join our Channel. Click here – HTMD WhatsApp.
Author
Krishna. R is a computer enthusiast. She loves writing on Windows 11 and Intune related technologies. She likes to share her knowledge, quick tips, and tricks with Windows 11 or Windows 10 with the community.
