Let’s learn the details of MDE Troubleshooting Tools. We have some exciting information to share with you about the MDE Troubleshooter, a remarkable graphical user interface (GUI) tool designed specifically for troubleshooting MS Defender for Endpoint.
This tool promises to revolutionize how we tackle issues and enhance the overall experience of managing and resolving security problems. Currently, administrators face a significant challenge when it comes to troubleshooting Microsoft Defender for Endpoint. The process often involves diving into registry settings, sifting through event logs, and executing PowerShell commands to gather detailed information.
Alternatively, they can utilize the MS Defender for Endpoint analyzer tools, which operate through a command-line interface. However, these methods can be time-consuming, complex, and daunting for many administrators.
The MS Defender for Endpoint Troubleshooting Tools are powerful troubleshooting resources. These tools include the classic ones such as event logs, PowerShell commands, etc. Some of these tools are command line tools, and there is a community tool called MDE troubleshooter.
What is Microsoft 365 Defender?

Microsoft 365 Defender is a unified solution that works across Endpoints, Identities, Emails, Apps, and Cloud Applications. This helps organizations with pre- and post-breach scenarios. Enterprise defense suite that natively coordinates with the following.
1. Detection
2. Prevention
3. Investigation
4. Response
What is Microsoft Defender for Endpoint?
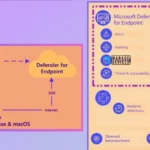
Microsoft Defender for Endpoint (MDE) is an enterprise endpoint security platform that provides advanced threat protection, detection, and response capabilities. MDE integrates with Intune to support End to End Device Management.
What are the Troubleshooting Options for MDE?
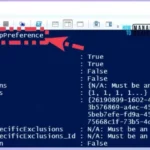
Registry, Event Logs, Reports, etc., are the basic troubleshooting tools for MDE. There is a Powershell command to help you troubleshoot MD scenarios and get the MpPreference that is the commandlet.
1. Microsoft Defender for Endpoint client analyzer – Command-line tool
2. Microsoft Defender for Endpoint Troubleshooter – GUI Tool
What is Microsoft Defender for Endpoint Troubleshooter?
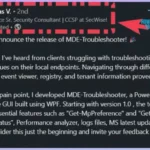
Thomas created Microsoft Defender for Endpoint Troubleshooter. He knows the trouble of getting different settings of MDE onboarded Windows devices, sometimes event logs, Reports, etc. Thomas wants to help his customers or admins to get more user-friendly or admin-friendly tools to get everything in one place.
Video – MDE Troubleshooting Tools | Microsoft Defender for Endpoint
During the video presentation, we were introduced to the remarkable MDE Troubleshooter tool developed by the talented Thomas. This tool showcased its capabilities in simplifying the troubleshooting process for Microsoft Defender for Endpoint.
MDE Troubleshooting Tools
There are different tools to troubleshoot MDE issues, and the basic tools are event logs, registry, PowerShell, etc, as we explained in the above FAQ. So I’m not going to cover in detail what are the registry keys, where is the event log, what are the PowerShell comments, etc., because we covered this in the previous posts Microsoft Defender for Endpoint Portal Walkthrough.
Let’s look into the Microsoft Defender client analyzer tool. To run this tool, you must run the Cmd file shown in the below window. Then you can download the MDE client analyzer tool from Microsoft documentation.
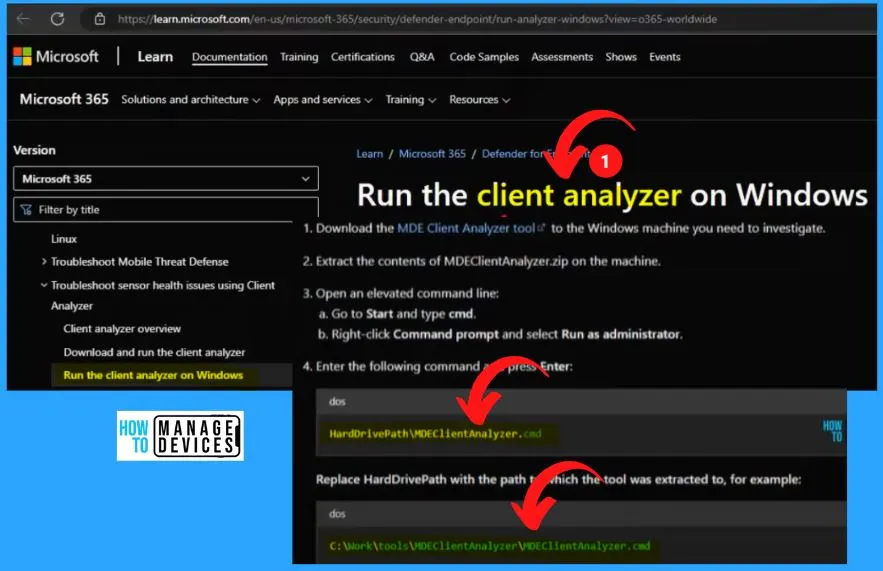
The MDEClientAnalyzer.cmd file is a command-line tool that typically requires administrative privileges. Without admin access, running the tool may fail due to insufficient permissions. This file is designed to perform in-depth analysis and diagnostic checks on the Microsoft Defender for the Endpoint client.
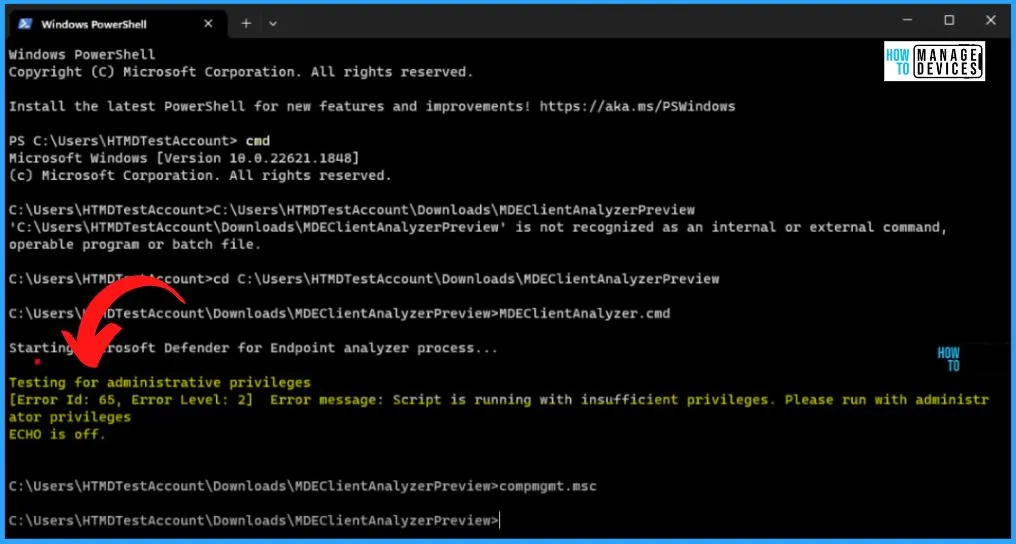
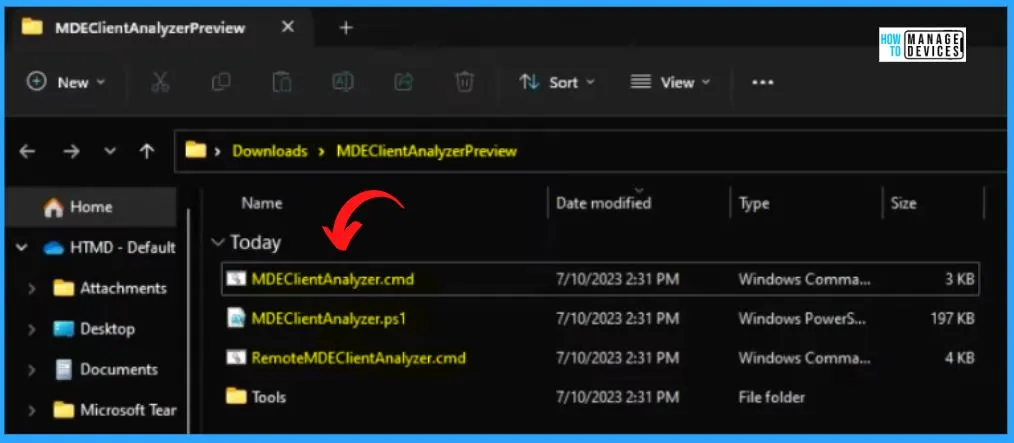
Within the MDEClientAnalyzer tool, files and folders contribute to its functionality and effectiveness. This tool shows the CMD file, the PowerShell script, and again there is a CMD file containing a folder called Tool.
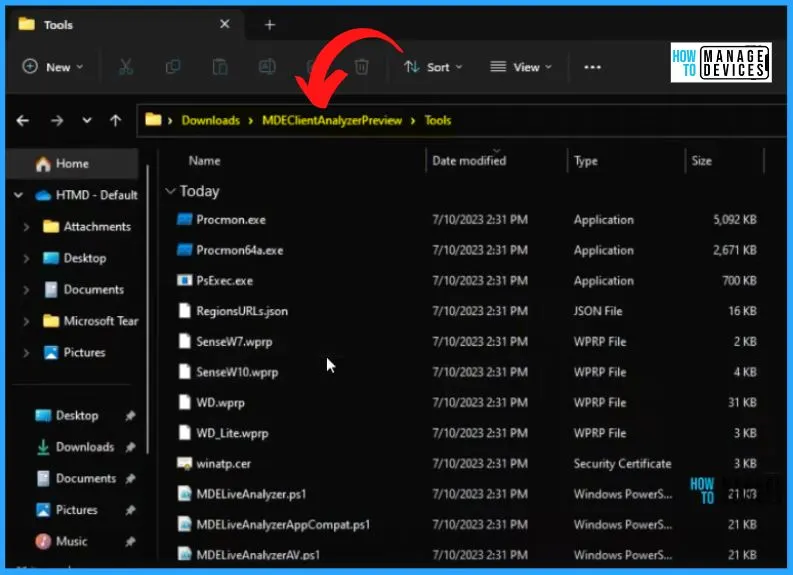
The Tool folder within the MDEClientAnalyzer tool represents an additional layer of resources and utilities that complement the primary CMD file and PowerShell script.
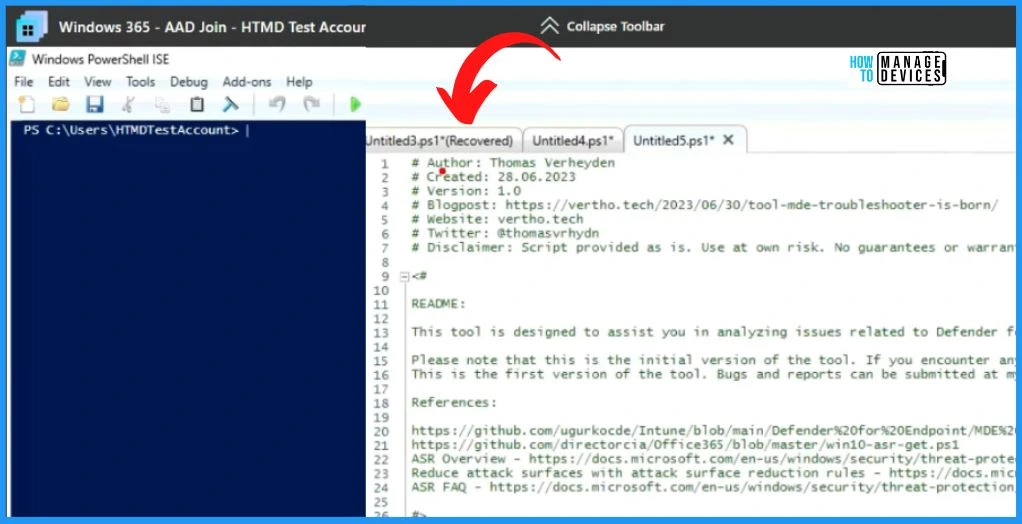
The PowerShell script developed by Thomas for the MDE Troubleshooter GUI tool is a valuable resource that enhances the troubleshooting capabilities of Microsoft Defender for Endpoint. The below window shows the Powershell script. You can download this Powershell script from GitHub, and you can use it.
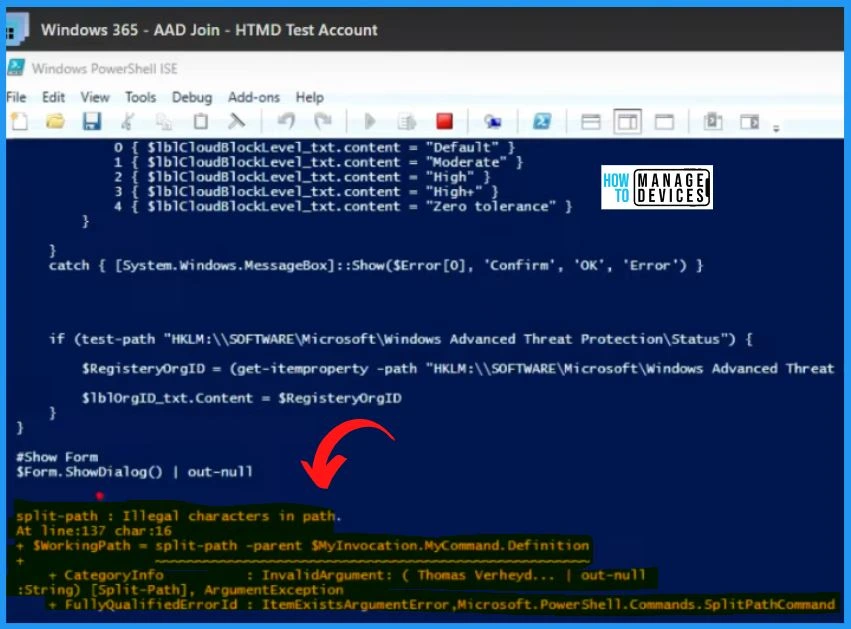
When attempting to execute the PowerShell script, you may encounter an error, as indicated. However, despite the error, the noteworthy aspect is that the tool successfully launches and presents a pop-up. This means the MDE Troubleshooter GUI tool is operational, allowing you to access its features and functionalities.
MDE Troubleshooter
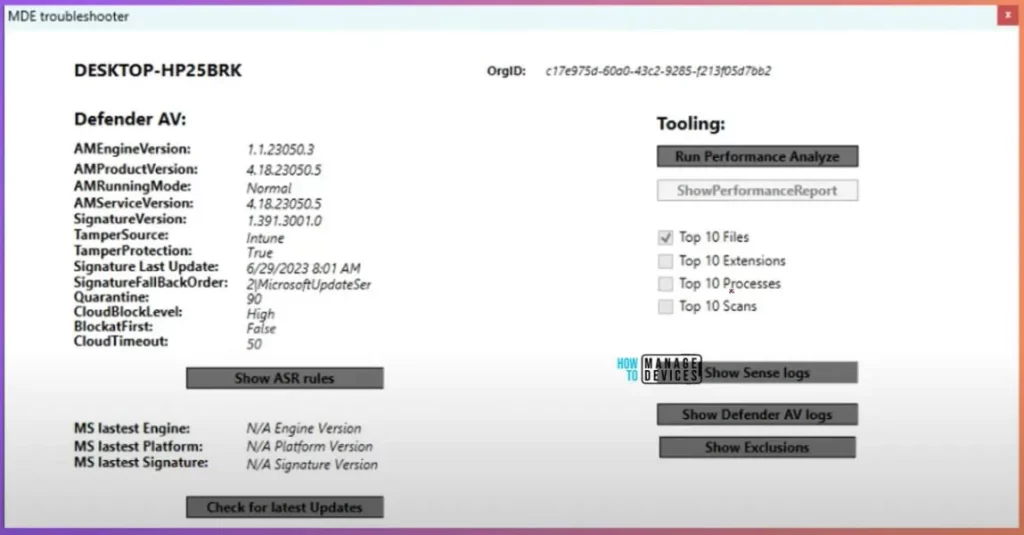
The below window shows the MDE troubleshooter. It is easy to get the defender for the endpoint engine version, product version, running mode, service version, signature version, etc. If you are getting confused with all these versions, we have a video related to these versions.
| Defender AV |
|---|
| AMEngineVersion |
| AMProductVersion |
| AMRunningMode |
| AMServiceVersion |
| SignatureVersion |
| TamperSource |
| TamperProtection |
| Signature Last Update |
| SignatureFallBackOrder |
| Quarantine |
| CloudBlockLevel |
| CloudTimeout |
| BlockatFirst |
You can download MDE Troubleshooter tool from here – GitHub – ThomasVrhydn/MDE-troubleshooter.
MDE Troubleshooter Show ASR Rules
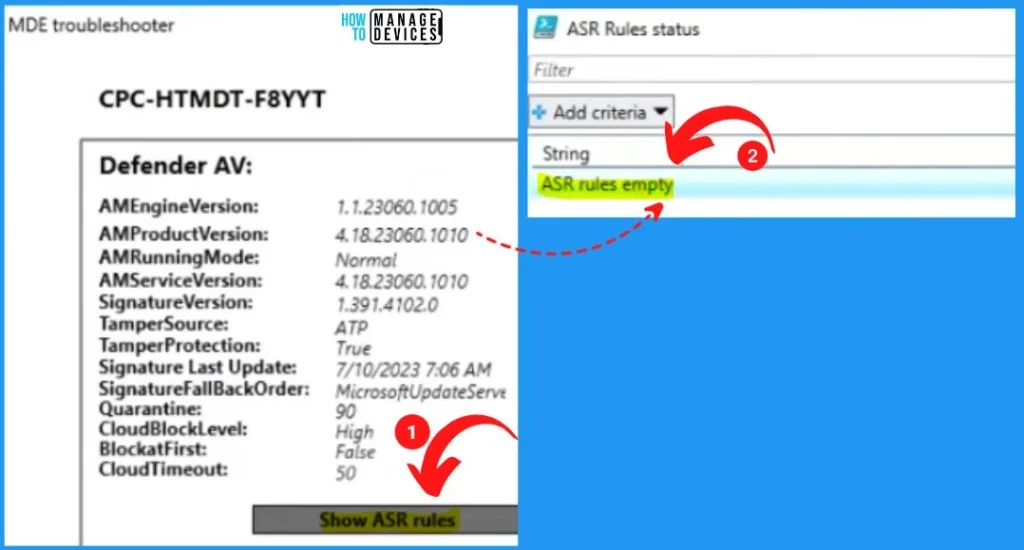
To check the ASR rules configured for this Windows 11 client, click the “Show ASR Rules” button below. We have not applied any ASR rules, so it shows the ASR rules are empty.
Run Performance Analyze
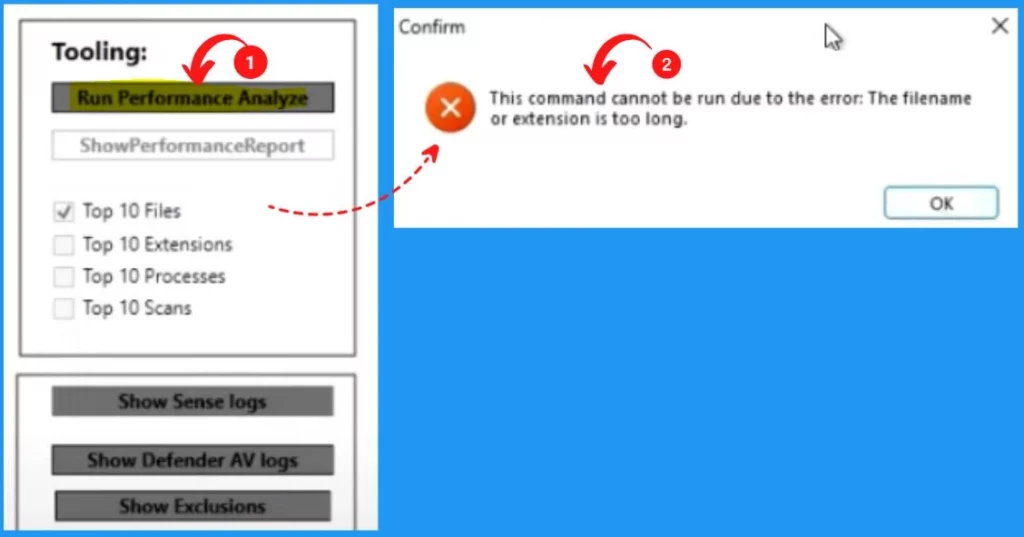
Let’s discuss the tooling options for the run performance analysis. This is the analyzer tool. If you click the Run performance analyze button, you can see the below message “This command cannot be run due to the error. The filename or extension is too long.”
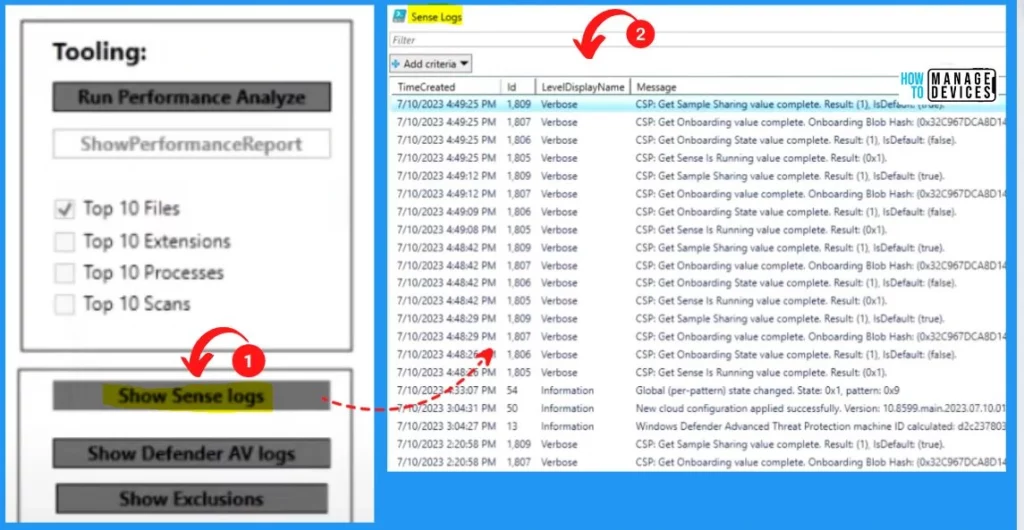
Show Sense Logs
Show sense logs are the button shown in the MDE Troubleshooter. While clicking the button, you will be able to see the logs. It is useful to get this information rather than going into different applications like event logs, etc.
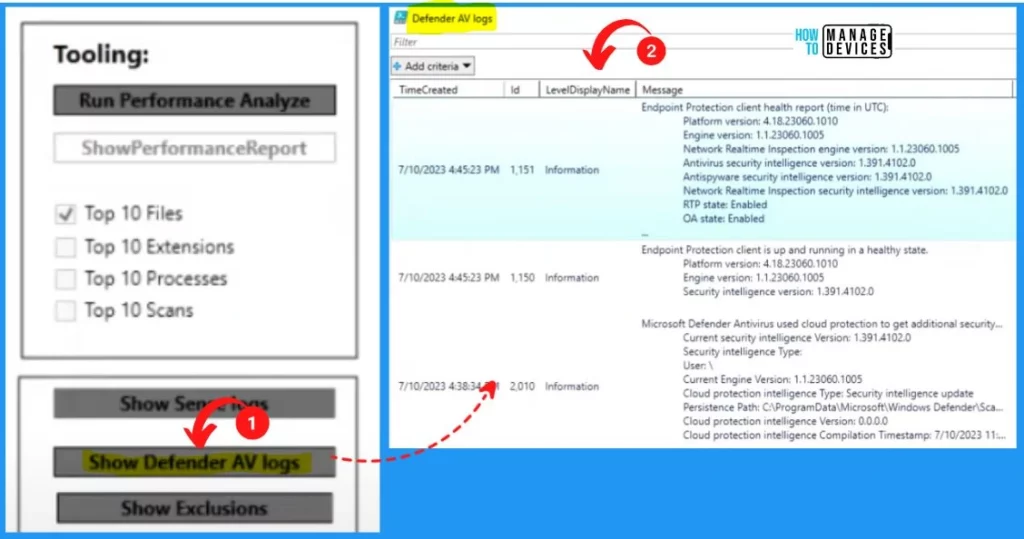
Show Defender AV Logs
Let’s check the Show Defender AV Logs in MDE Troubleshooter. This is very useful information. Click the Show Defender AV Logs button from the below window to see the Defender AV Logs information.
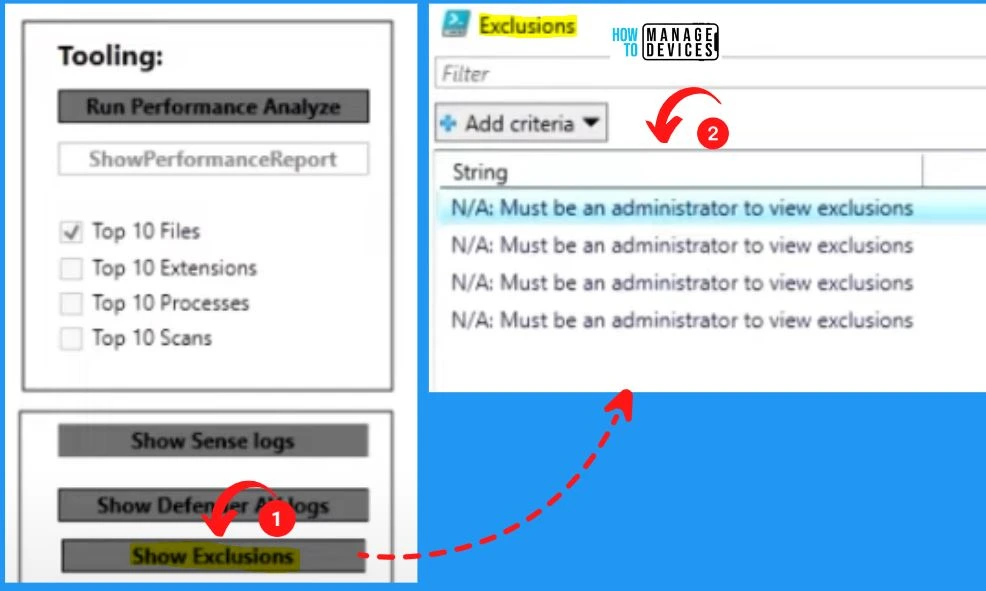
Show Exclusions
Let’s check the show Exclusions options in MDE Troubleshooter. Show exclusion is an important option in MDE troubleshooting. To get the show exclusions, we need admin access.
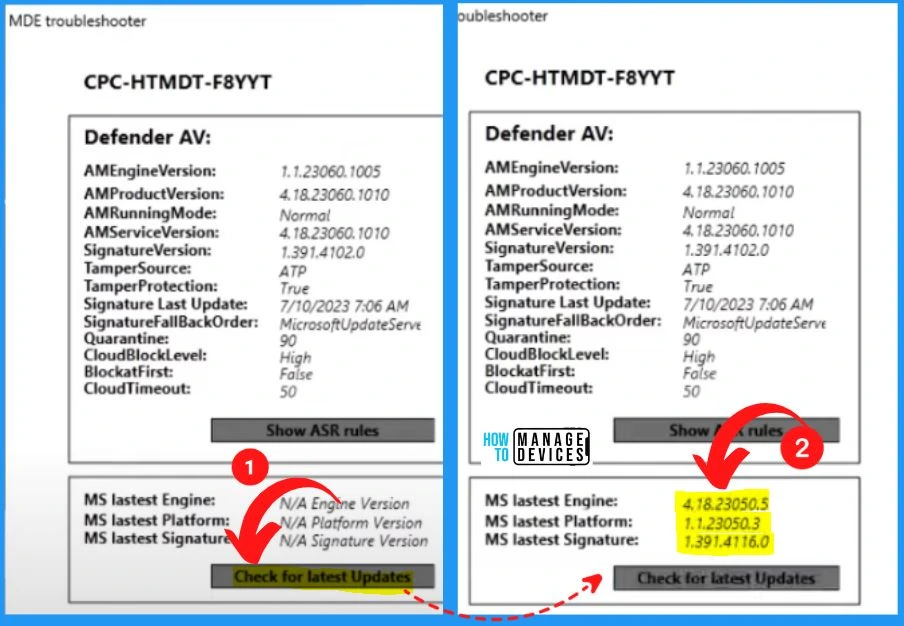
Check for the Latest Updates Option in MDE Troubleshooter
Check for the latest update button helps you show the latest update after clicking the button to contact the cloud service and give the latest information. It includes the following.
- MS Lastest Engine
- MS Lastest Platform
- MS Latest Signature
Author
About Author – Vidya is a computer enthusiast. She is here to share quick tips and tricks with Windows 11 or Windows 10 users. She loves writing on Windows 11 and related technologies. She is also keen to find solutions and write about day-to-day tech problems.
