Exciting News! Microsoft introduced new Azure AD Audit Logs. You can use the log analytics workspace to store these logs to Log Analytics workspace. New Microsoft Graph Activity Logs in Azure Active Directory Diagnostic Settings.
On March 14th, 2023, Microsoft introduced a new log called MicrosoftGraphActivityLogs along with other log files listed down. These log files offer details of API requests made to Microsoft Graph for resources in the tenant. EnrichedOffice365AuditLogs is another exciting log file that would be very helpful for troubleshooting
Azure Active Directory (Azure AD) diagnostic settings allow you to configure logs and metrics for monitoring and analyzing activity in your Azure AD tenant. When you create a diagnostic setting, you can specify the type of data you want to collect, such as audit logs, sign-in logs, or directory logs, and where you want to send the data, such as a storage account, Event Hub, or Log Analytics workspace.
The Microsoft Graph Activity Logs comprehensively record all API requests made to Microsoft Graph for resources within an Azure AD tenant. These logs provide detailed information on the nature of the requests, including the user or application that made the request, the resource being accessed, and the specific action taken.
- Windows 11 Azure AD Join Manual Process Windows 10
- How to Add Azure Virtual Desktop Session Host to Azure AD Join Guide AVD
What is Azure AD EnrichedOffice365AuditLogs?
The EnrichedOffice365AuditLogs is there to provide additional context for Office 365 audit events. This would be useful for troubleshooting scenarios.
What is Azure AD MicrosoftGraphActivityLogs?
The Microsoft Graph Activity Logs comprehensively record all API requests made to Microsoft Graph for resources within an Azure AD tenant.
Integrate Azure AD Logs with Azure Monitor
Check out the following video on options to Export Azure AD Logs in Azure Monitor. Also, learn how to analyze the Logs using KQL Queries.
New Azure AD Logs
The Microsoft Graph Activity Logs enable administrators and developers to monitor and analyze the usage patterns of Microsoft Graph within their tenants. This can help to identify potential issues or anomalies, track the performance of applications and users, and optimize the use of resources.
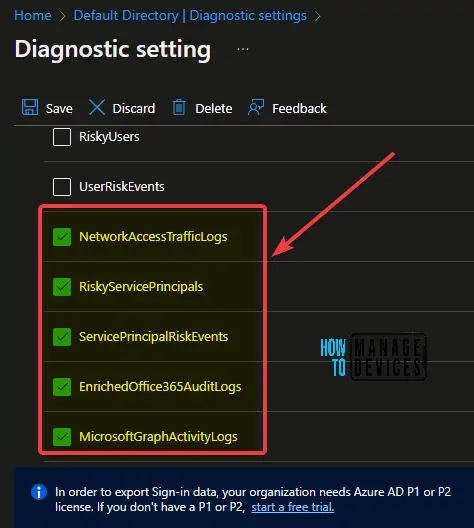
Microsoft introduced new Azure AD logs, as listed below. These log files are available in the HTMD LAB. So we could send this data to the Log Analytics workspace of your choice. In order to export Sign-in data, your organization needs Azure AD P1 or P2 license.
- NetworkAccessTrafficLogs
- RiskyServicePrincipals
- ServicePrincipalRiskEvents
- EnrichedOffice365AuditLogs
- MicrosoftGraphActivityLogs
Microsoft Graph Activity Logs
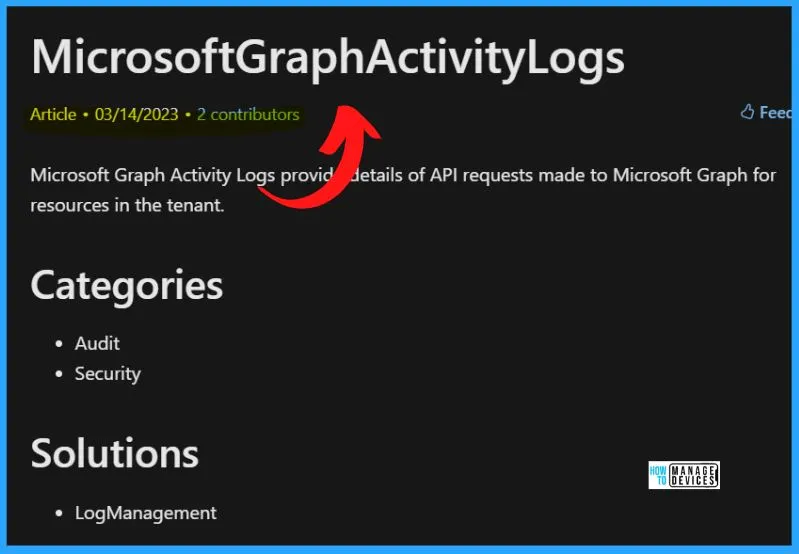
MicrosoftGraphActivityLogs serves as a powerful diagnostic tool for managing and monitoring Microsoft Graph usage. The categories and the solutions of MicrosoftGraphActivityLogs are shown in the below list and screenshot.
- Categories
- Audit
- Security
- Solutions
- LogManagement
Note! – The MicrosoftGraphActivityLogs is in preview but still visible in Azure AD. At this time, selecting these options will not add new logs to your workspace unless your organization was included in the preview
| Column | Type | Description |
|---|---|---|
| AadTenantId | string | The Azure AD tenant ID. |
| ApiVersion | string | The API version of the event. |
| AppId | string | The duration of the request is in milliseconds. |
| ClientRequestId | string | Optional. The client request identifier when sent. If no client request identifier is sent, the value will be equal to the operation identifier. |
| DurationMs | int | The duration of the request is in milliseconds. |
| IpAddress | string | The IP address of the client from where the request occurred. |
| Location | string | The identifier represents the sign-in activity. |
| OperationId | string | The identifier for the batch. For non-batched requests, this will be unique per request. For batched requests, this will be the same for all requests in the batch. |
| RequestId | string | The identifier represents the sign-in activity. |
| RequestMethod | string | The HTTP method of the event. |
| RequestUri | string | The URI of the request. |
| ResponseSizeBytes | int | The size of the response in Bytes. |
| ResponseStatusCode | int | The HTTP response status code for the event. |
| Roles | string | The roles in token claims. |
| Scopes | string | The scopes in token claims. |
| ServicePrincipalId | string | The identifier of the servicePrincipal making the request. |
| SignInActivityId | string | The timestamp at the token was issued at. |
| SourceSystem | string | |
| TenantId | string | |
| TimeGenerated | datetime | The date and time the request was received. |
| TokenIssuedAt | datetime | The user agent information related to the request. |
| Type | string | The name of the table |
| UserAgent | string | The user agent information related to request. |
| UserId | string | The user agent information related to the request. |
MicrosoftGraphActivityLogs in Azure Active Directory (Azure AD) portal
Diagnostic settings configure the streaming export of platform logs and metrics for a resource to the destination of your choice. You may create up to five diagnostic settings to send logs and metrics to independent destinations.
- Navigate to the Azure AD blade in the Azure portal
- Select “Diagnostic settings” from the left-hand menu
- The Diagnostic Settings show the new Microsoft Graph Activity Logs
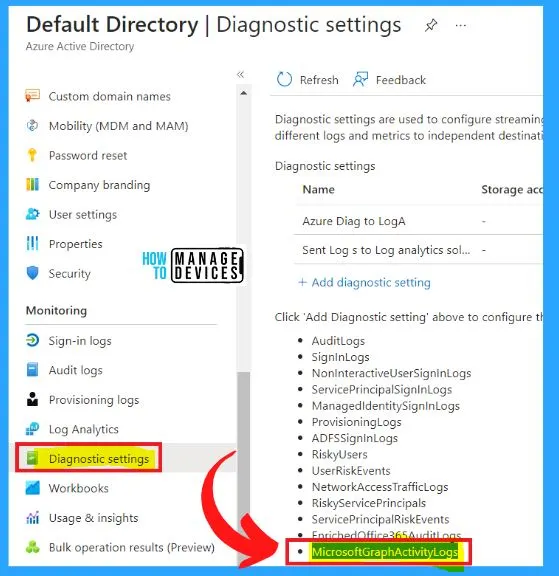
Diagnostic Settings for MicrosoftGraphActivityLogs
Click the ‘Add Diagnostic setting‘ above the screenshot to configure the Microsoft Graph Activity Logs. Microsoft Graph Activity Logs are combined with other Azure AD diagnostic tools to ensure the security and reliability of your Azure AD environment.
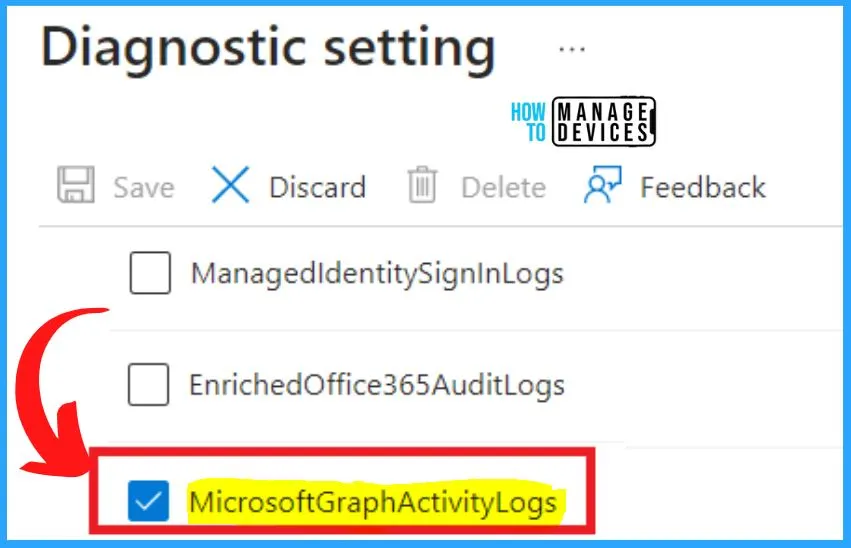
Resource – Stream Azure Active Directory logs to Azure Monitor logs – Microsoft Entra | Microsoft Learn
Author
About Author – Vidya is a computer enthusiast. She is here to share quick tips and tricks with Windows 11 or Windows 10 users. She loves writing on Windows 11 and related technologies. She is also keen to find solutions and write about day-to-day tech problems.
