This article is on Dev Tools of Microsoft Edge Browser in Windows 11 and its features. Microsoft Edge is a modern browser that offers a fast, secure, and customizable web experience. But did you know it also comes with a built-in web development tool, Microsoft Edge Dev Tools? Dev Tools is a web development tool set next to a rendered webpage in the browser.
Dev Tools provides a powerful way to inspect and debug web pages and applications. You can even edit source files and create website projects, all within the DevTools environment. Microsoft Edge DevTools is a powerful set of debugging and diagnostic tools built into the Microsoft Edge web browser.
The Dev Tools provide powerful tools for web developers and designers to debug and optimize web pages. This tool helps them to build their webpage more accurately. There are various types of methods for accessing the dev tools.
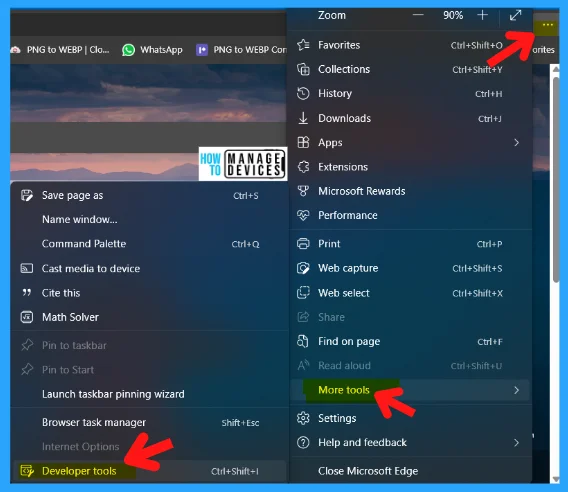
The DevTools can be accessed by pressing the F12 key or by selecting Developer Tools from the … (three-dot) menu in the top right corner of the browser window. This article is all about the features present in the Developer Tools.
Uses of Dev Tools in Microsoft Edge
As we read in the above paragraphs, Microsoft Dev Tools provides a powerful way to inspect and debug web pages and applications. Dev Tools is a web development tool set next to a rendered webpage in the browser. You can perform the following listed tasks using Dev Tools.
- Inspect, tweak, and change the styles of elements in the webpage using live tools with a visual interface.
- Inspect where the browser stored content to construct the webpage, including .HTML, .css, .js, and .png file formats.
- Emulate your website’s behavior on different devices and simulate a mobile environment with varying network conditions. Inspect the network traffic and see the location of the problems.
- Debug your JavaScript using breakpoint debugging and with the live console.
- Find memory problems and rendering issues with your web apps.
- Find accessibility, performance, compatibility, and security issues in your products, and use DevTools to fix the accessibility issues.
- Use a development environment to sync changes in DevTools with the file system and from the web.
How to Open Dev Tools
In Microsoft Edge, you can open DevTools using the mouse or keyboard in the following ways. Which tool is opened depends on how you open DevTools. The main process to open DevTools is shown in steps.
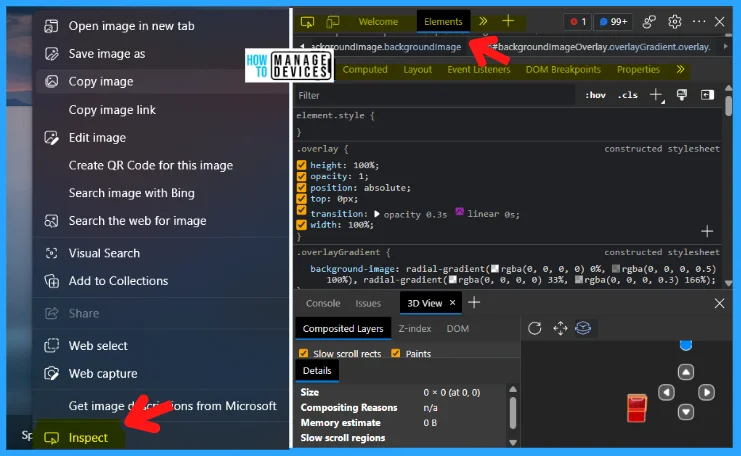
The first step to open Dev Tools is Right-click any item on a webpage and then select Inspect. The Elements tool, with the DOM tree, expanded to show the right-clicked page element.
The second step to opening Dev Tools is to press Ctrl+Shift+I for Windows and Linux, or you can use Command + Option + I for macOS: the previously used tool or the Welcome tool.
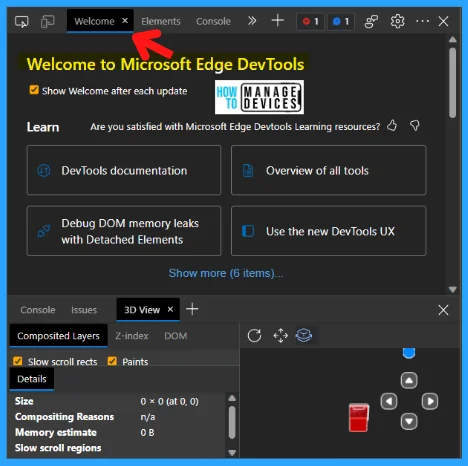
The third step to open the Dev tools is very simple: open the Microsoft Edge browser, press the F12 key, then The previously used tool or the Welcome tool. The image illustrates above in Fig. 3.
Some additional ways are available to open dev tools except for the above procedure. The different ways to open dev tools have been described hereunder.
Select Settings and more (…) three dots> More tools > Developer tools on the Microsoft Edge toolbar: the previously used or the Welcome tool.
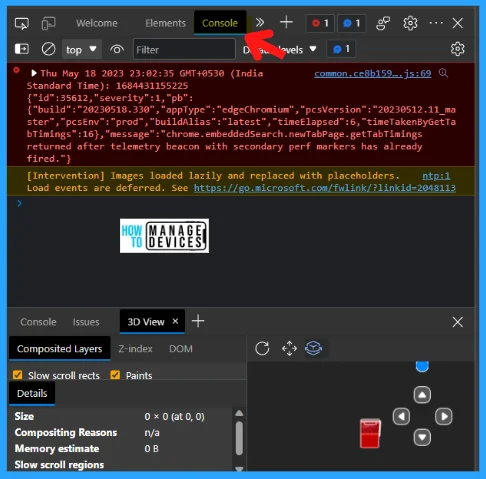
Press Ctrl+Shift+J for Windows and Linux, or use Command+Option+J for macOS. It will redirect you to the Console tool.
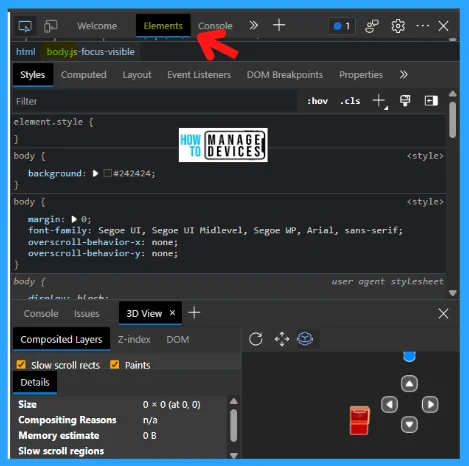
Press Ctrl+Shift+C for Windows and Linux, or use Command+Option+C for macOS. The Elements tool, with the DOM tree, expanded to show the <body> element.
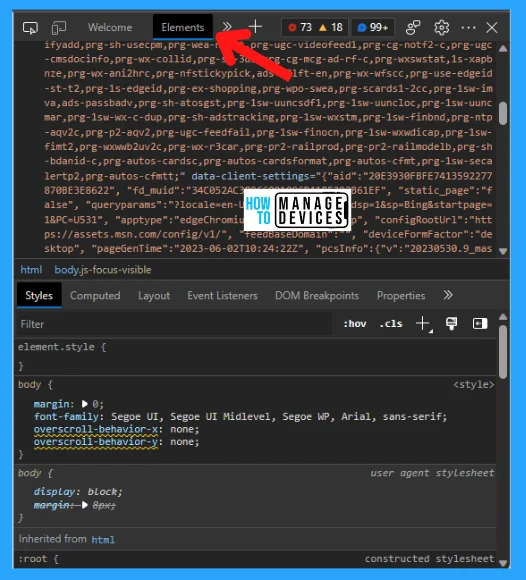
Press Shift+F10 to open the right-click menu. To select the Inspect command, press Up Arrow and then Enter. The Elements tool, with the DOM tree, expanded to show the <html> element.
Similarly, press Tab or Shift+Tab to put focus on a page element. Then press Shift+F10 to open the right-click menu. To select the Inspect command, press Up Arrow and then Enter. With the DOM tree, the Elements tool expanded to show the focused page element.

Once opened, the DevTools provide a wide range of functionality for inspecting and debugging web pages. Some of the key features of the DevTools include:
| Features of the DevTools | Used to |
|---|---|
| DOM Inspector | Allows you to inspect the HTML structure of a web page, view and edit CSS styles, and explore the page layout. |
| Console | Provides a command-line interface for executing JavaScript code, logging messages, and debugging errors. |
| Network Monitor | This shows all the requests the browser makes to load a web page, including the HTTP headers, response codes, and timings. |
| Performance Analyzer | Provides insights into the performance of a web page, including metrics such as page load time, rendering time, and JavaScript execution time. |
| Debugger | Allows you to step through JavaScript code and set breakpoints to pause execution and inspect variables. |
Main Dev Tools in Microsoft Edge
DevTools consists of several tools that are organized into tabs or panels. Each tool has a specific purpose and functionality. Here are some of the main tools that you can use in DevTools are described with their illustrations.
Elements: This tool lets you inspect and edit HTML and CSS elements on a webpage. You can also view accessibility properties, event listeners, and DOM mutation breakpoints.
Console: This tool lets you interact with JavaScript code on a webpage. You can run commands, log messages, view errors and warnings, and inspect objects and variables.
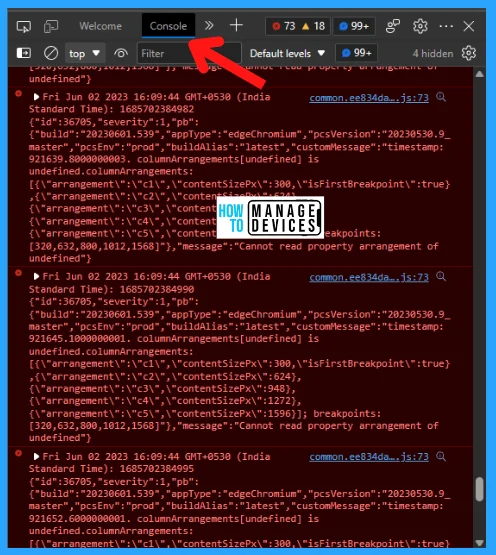
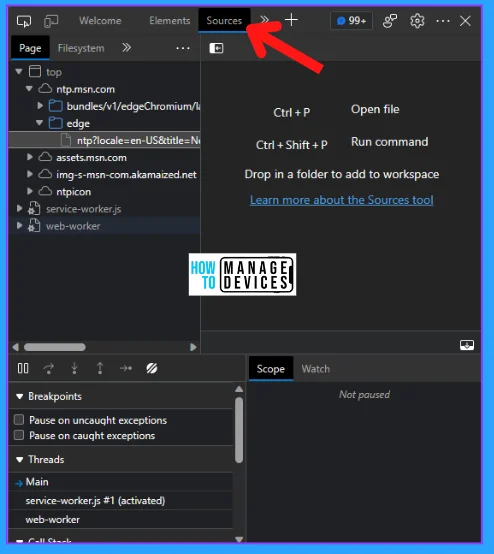
Sources: This tool lets you debug JavaScript code on a webpage. You can set breakpoints, step through code execution, watch variables, evaluate expressions, and edit source files.
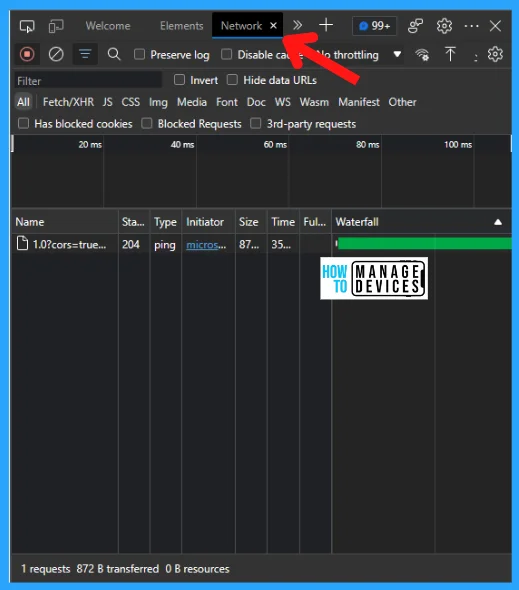
Network: This tool lets you monitor and inspect network requests and responses on a webpage. You can filter requests by type of status, view request headers and bodies, view timing information, and export network data.
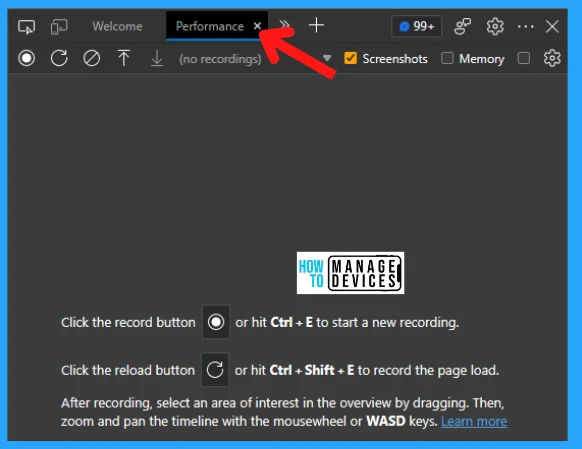
Performance: This tool lets you record and analyze the performance of a webpage. You can view CPU usage, memory consumption, frame rate, network activity, and more.
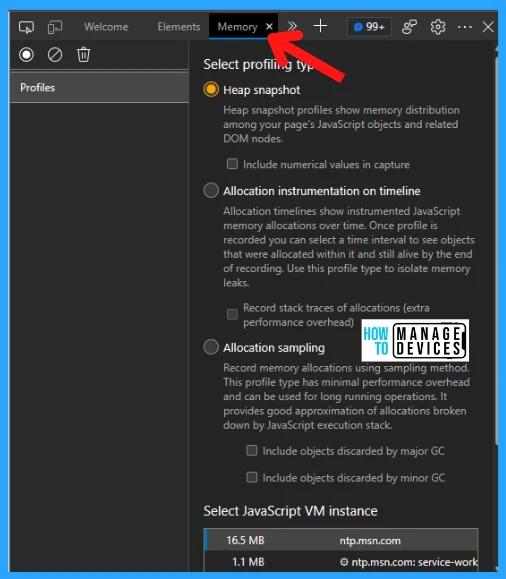
Memory: This tool lets you diagnose memory problems on a webpage. You can take heap snapshots to see what objects are allocated in memory and how they are referenced. You can also record allocation timelines to see how memory usage changes.
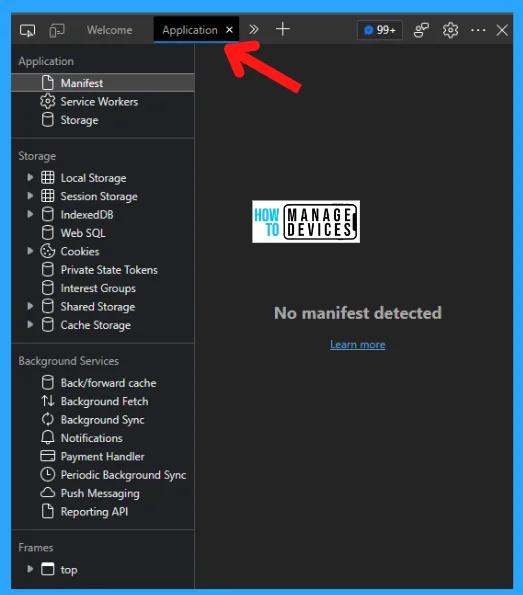
Application: This tool lets you inspect and manage web app data on a webpage. You can view cookies, local storage, session storage, indexed DN database, service workers, cache storage, web app manifests, background sync events, push notifications, etc.
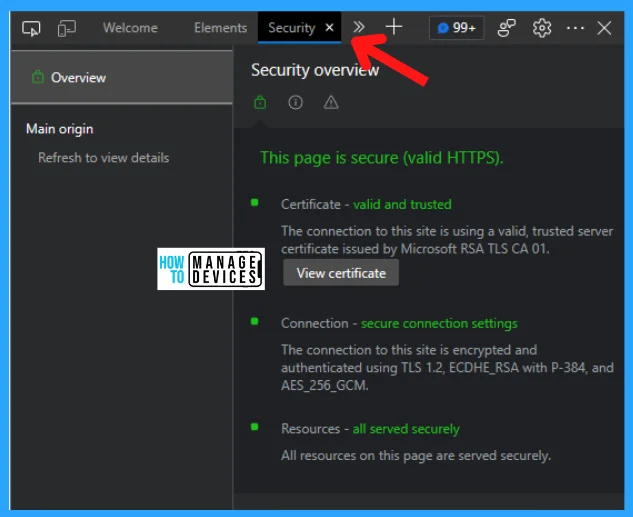
Security: This tool lets you inspect and troubleshoot security issues on a webpage. So you can able to find out the issues and resolve them, if possible.
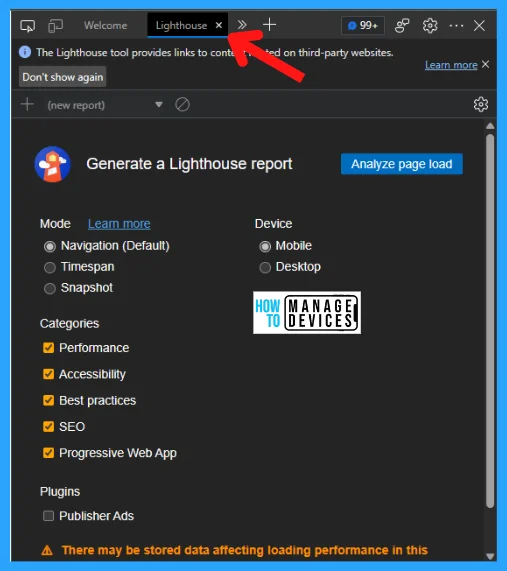
Lighthouse: Use the lighthouse tool to identify and fix common problems that affect your site’s performance, accessibility, and user experience. The lighthouse tool is previously called Audits Tool.
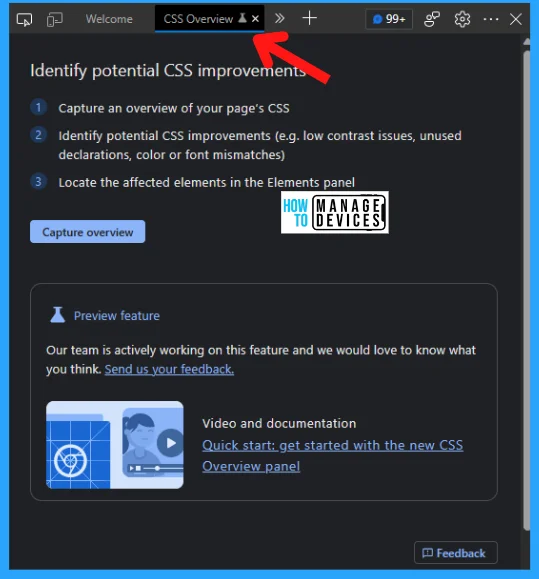
CSS Overview: The CSS Overview tool captures an overview of the CSS code used on a webpage and displays a report about the colors, fonts, and media queries used. The device also identifies potential color contrast issues and unused CSS declaration issues.
Main Tool Bar in Dev Tools
DevTools gives you an amazing amount of power to inspect, debug, and change the website currently displayed in the browser. Most of the tools show the changes live. Live updates make the tools incredibly useful to refine a web project’s appearance and navigation or functionality without the need to refresh or build it.
The main tools bar is available at the top of the dev tools; the detail of the main tools bar is illustrated in the image below (source: Microsoft).

The overall experience is that the DevTools provide powerful tools for web developers and designers to debug and optimize their web pages.
I hope the information on Dev Tools of Microsoft Edge Browser in Windows 11 is helpful. Please follow us on HTMD Community and visit our website HTMD Forum if you like our content. Suggest improvements, if any, and we love to know which topic you want us to explore next.
Author
Alok is a Master of Computer Applications (MCA) graduate. He loves writing on Windows 11 and related technologies. He likes to share his knowledge, quick tips, and tricks with Windows 11 or Windows 10 with the community.


