Let’s learn the Detailed Overview of Wireshark in Windows 11. The Wireshark is a developing tool created to analyze network packets closely. Wireshark, a packet analyzer, is used for various purposes such as troubleshooting networks, understanding the communication between two systems, protocol developments, etc.
System Administrators, Network Engineers, Network Enthusiasts, Network Security professionals, and Back Hat Hackers like Wireshark. It is a cross-platform software that runs on Linux, Windows, macOS, and any other OS.
Wireshark is a software tool used to scrutinize network traffic through a network interface. It is entirely free and open source for everyone. This software is widely used to analysis of data packets in a network.

- Learn How to Install Wireshark in Windows 11
- Wireshark Installation using Intune Deployment Step-By-Step Guide
- How to Deploy Wireshark Using SCCM Application Model
About Wireshark
Wireshark is the world’s foremost network protocol analyzer. It lets you see what is happening on your network at a microscopic level.
What is Wireshark?
Wireshark is a network packet analyzer, and a network packet analyzer presents captured packet data in as much detail as possible. You could think of a network packet analyzer as a measuring device for examining what is happening inside a network cable, just like an electrician uses a voltmeter to examine what is happening inside an electric cable (but at a higher level).
Previously, these tools were either costly, proprietary, or both. However, with the advent of Wireshark, that has changed. Wireshark is available for free, is open source, and is one of the best packet analyzers available today.
What is the Plotted Purpose of Wireshark?
There are many reasons why people use Wireshark widely. It is a free tool for every user, which is why people like to use it. It shows detailed information about a network with a great graphical representation. It can also be helpful in many other situations, here are some reasons listed below:
- Network Administrators use it to troubleshoot network problems
- Network Security Engineers use it to examine security problems
- Quality Assurance Engineers use it to verify network application
- Developers use it to debug protocol implementations
- People use it to learn network protocol internals
History of Wireshark in Brief
In 1997 Gerald Combs needed a tool to track the network problems and wanted to learn more about networking, so he started writing Ethereal as a way to solve both problems.
In July 1998, Ethereal was originally released after several pauses in development as version 0.2.0. Within days patches, bug reports, and words of encouragement started arriving, and Ethereal was on its way to success.
In October 1998, Guy Harris wanted something better than TCPview, so he started applying patches and contributing dissectors to Ethereal.
In 1998 Richard Sharpe, who was giving TCP/IP courses, noticed the potential of such courses and started following them to gather information if they supported the protocols that he needed. New protocols could be easily added, so he started contributing dissectors and contributing patches.
In 2006 the project moved house and re-materialized under a new name Wireshark (started with the name Ethereal).
In 2008 after many developments, Wireshark arrived at version 1.0, the first with minimum features implemented. This year, the first Wireshark Developer and User Conference was held and called Sharkfest. Wireshark 2.0 is released in the year 2015.
Wireshark in Windows 11 Overview
The Wireshark Network Analyzer interface has a menu in it, which we discuss in detail. This is called the Wireshark user interface. Wireshark’s main window contains the parts that are commonly known from many other GUI programs.
- Menu: Used to start actions.
- Main Toolbar: Provides quick access to frequently used items from the menu.
- Filter Toolbar: Allows users to set display filters to filter which packets are displayed.
- Packet List Pane: Displays a summary of each packet captured. You control what is displayed in the other two panes by clicking on packets in this pane.
- Packet Details Pane: Displays the packet selected in the packet list pane in more detail.
- Packet Bytes Pane: Displays the data from the packet selected in the packet list pane and highlights the field selected in the packet details pane.
- Packet Diagram Pane: Displays the packet selected in the packet list as a textbook-style diagram.
- Statusbar: Shows some detailed information about the current program state and the captured data.
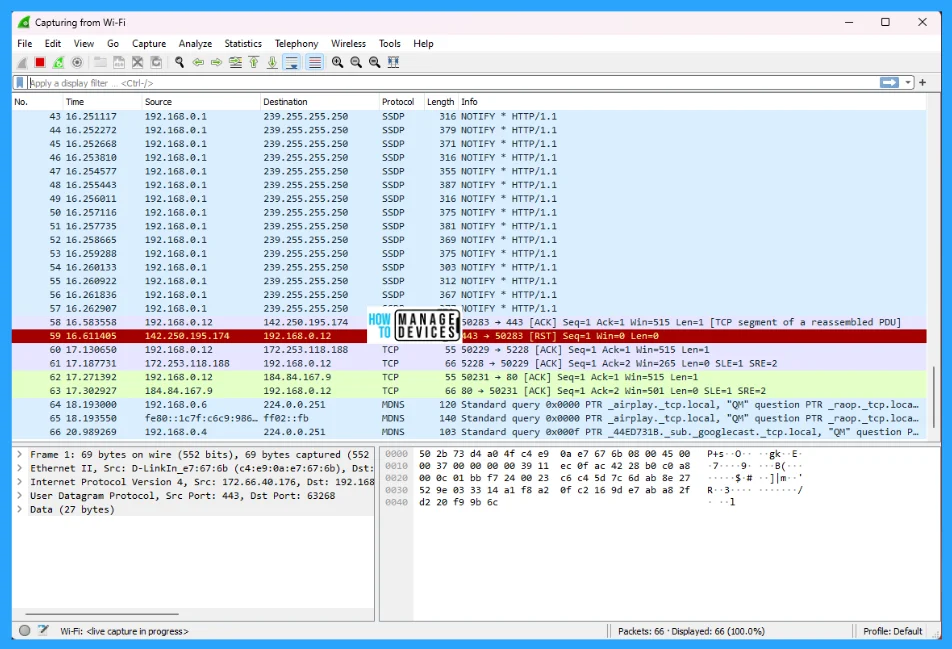
Main Menu Window of Wireshark
Wireshark’s main menu is located at the top of the main window in Windows 11. The main menu contains many file options that are listed below.
- File
- Edit
- View
- Go
- Capture
- Analyze
- Statistics
- Telephony
- Wireless
- Tools
- Help

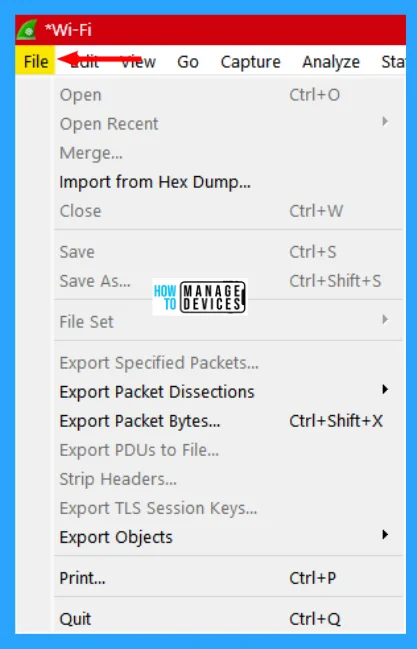
File Menu
The file menu contains items to open and merge capture files, save, print, or export capture files in whole or in part, and quit the Wireshark application. The Wireshark file menu contains the fields shown in the table below.
| Menu Item | Description |
|---|---|
| Open | This shows the file open dialog box that allows you to load a capture file for viewing. |
| Open Recent | This lets you open recently opened capture files. Clicking on one of the submenu items will open the corresponding capture file directly. |
| Merge | This menu item lets you merge a capture file into the currently loaded one. |
| Import from Hex Dump | This menu item brings up the import file dialog box that allows you to import a text file containing a hex dump into a new temporary capture. |
| Close | This menu item closes the current capture. If you have not saved the capture, you will be asked to do so first, this can be disabled by a priority setting. |
| Save | This menu item saves the current capture. If you have not set a default capture file name, Wireshark pops up the Save Capture File As dialog box. If you have already saved the current capture, this menu item will be greyed out. You cannot save a live capture while the capture is in progress. You must stop the capture in order to save. |
| Save As | This menu item allows you to save the current capture file to whatever file you would like. It pops up the Save Capture File As dialog box. |
| File Set > List Files | This menu item allows you to show a list of files in a file set. It pops up in the Wireshark List File Set dialog box. |
| File Set > Next File | If the currently loaded file is part of a file set, jump to the next file in the set. If it isn’t part of a file set or just the last file in that set, this item is greyed out. |
| File Set > Previous File | If the currently loaded file is part of a file set, jump to the previous file in the set. If it isn’t part of a file set or just the first file in that set, this item is greyed out. |
| Export Specified Packets | This menu item allows you to export all (or some) of the packets in the capture file to file. It pops up the Wireshark Export dialog box. |
| Export Packet Dissections | These menu items allow you to export the currently selected bytes in the packet bytes pane to a text file in a number of formats including plain, CSV, and XML. |
| Export Objects | These menu items allow you to export captured DICOM, HTTP, IMF, SMB, or TFTP objects into local files. It pops up a corresponding object list. |
| This menu item allows you to print all (or some) of the packets in the capture file. It pops up in the Wireshark Print dialog box. | |
| Quit | This menu item allows you to quit from Wireshark. Wireshark will ask to save your capture file if you have not previously saved it, this can be disabled by a priority setting. |
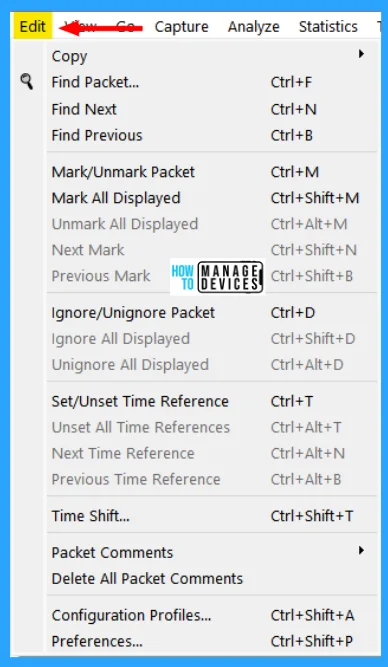
Edit Menu
This menu contains items to find a packet, time reference or mark one or more packets, handle configuration profiles, and set your preferences; (cut, copy, and paste are not presently implemented). The Edit menu contains the fields shown in the table below.
| Item | Description |
|---|---|
| Copy | These menu items will copy the packet list, packet details, or properties of the currently selected packet to the clipboard. |
| Find Packet | This menu item brings up a toolbar that allows you to find a packet by many criteria. |
| Find Next | This menu item tries to find the next packet matching the settings from “Find Packet…”. |
| Find Previous | This menu item tries to find the previous packet matching the settings from “Find Packet…”. |
| Mark/Unmark Packet | This menu item marks the currently selected packet. |
| Mark All Displayed Packets | This menu item marks all displayed packets. |
| Unmark All Displayed Packets | This menu item unmarks all displayed packets. |
| Next Mark | Find the next marked packet. |
| Previous Mark | Find the previous marked packet. |
| Ignore/Unignore Packet | This menu item marks the currently selected packet as ignored. |
| Ignore All Displayed | This menu item marks all displayed packets as ignored. |
| Unignore All Displayed | This menu item unmarks all ignored packets. |
| Set/Unset Time Reference | This menu item sets a time reference on the currently selected packet. |
| Unset All Time References | This menu item removes all time references on the packets. |
| Next Time Reference | This menu item tries to find the next time referenced packet. |
| Previous Time Reference | This menu item tries to find the previous time-referenced packet. |
| Time Shift | Opens the “Time Shift” dialog, which allows you to adjust the timestamps of some or all packets. |
| Packet Comment | Opens the “Packet Comment” dialog, which lets you add a comment to a single packet. Note that the ability to save packet comments depends on your file format. For example, pcapng supports comments, pcap does not. |
| Delete All Packet Comments | This will delete all comments from all packets. Note that the ability to save and capture comments depends on your file format. For example, pcapng supports comments, pcap does not. |
| Inject TLS Secrets | Embeds the used TLS decryption secrets into the capture file, which lets TLS be decrypted without having the separate key log file. Note that the ability to save decryption secrets depends on your file format. For example, pcapng supports Decryption Secrets Blocks, pcap does not. |
| Discard All Secrets | This will discard all embedded decryption secrets from the capture file. Note that the ability to save decryption secrets depends on your file format. E.g., pcapng supports Decryption Secrets Blocks, pcap does not. |
| Configuration Profiles | This menu item brings up a dialog box for handling configuration profiles. |
| Preferences | This menu item brings up a dialog box that allows you to set preferences for many parameters that control Wireshark. You can also save your preferences so Wireshark will use them the next time you start it. |
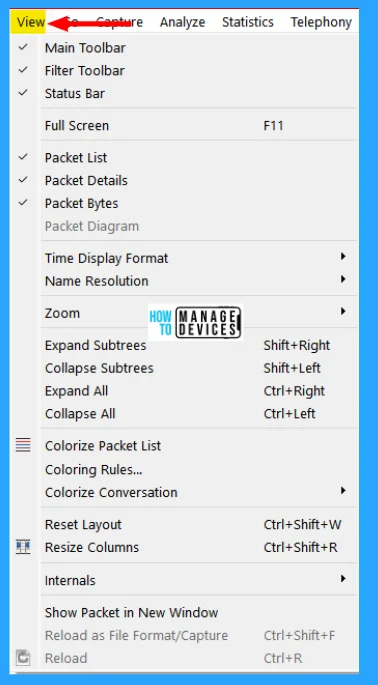
View Menu
This menu controls the display of the captured data, including the colorization of packets, zooming the font, showing a packet in a separate window, and expanding and collapsing trees in packet details. The Wireshark View menu contains the fields shown in the table below.
| Menu Item | Description |
|---|---|
| Main Toolbar | This menu item hides or shows the main toolbar. |
| Filter Toolbar | This menu item hides or shows the filter toolbar. |
| Wireless Toolbar | This menu item hides or shows the wireless toolbar. May not be present on some platforms. |
| Status Bar | This menu item hides or shows the status bar. |
| Packet List | This menu item hides or shows the packet list pane. |
| Packet Details | This menu item hides or shows the packet details pane. |
| Packet Bytes | This menu item hides or shows the packet bytes pane. |
| Packet Diagram | This menu item hides or shows the packet diagram pane. |
| Time Display Format > Date and Time of Day: 1970-01-01 01:02:03.123456 | Selecting this tells Wireshark to display the timestamps in date and time of day format. The fields “Time of Day”, “Date and Time of Day”, “Seconds Since First Captured Packet”, “Seconds Since Previous Captured Packet” and “Seconds Since Previous Displayed Packet” are mutually exclusive. |
| Time Display Format > Time of Day: 01:02:03.123456 | Selecting this tells Wireshark to display time stamps in time-of-day format. |
| Time Display Format > Seconds Since Epoch (1970-01-01): 1234567890.123456 | Selecting this tells Wireshark to display time stamps in seconds since 1970-01-01 00:00:00. |
| Time Display Format > Seconds Since First Captured Packet: 123.123456 | Selecting this tells Wireshark to display time stamps in seconds since the first captured packet format. |
| Time Display Format > Seconds Since Previous Captured Packet: 1.123456 | Selecting this tells Wireshark to display time stamps in seconds since the previously captured packet format. |
| Time Display Format > Seconds Since Previous Displayed Packet: 1.123456 | Selecting this tells Wireshark to display time stamps in seconds since previously displayed packet format. |
| Time Display Format > Automatic (File Format Precision) | Selecting this tells Wireshark to display time stamps with the precision given by the capture file format used. The fields “Automatic”, “Seconds” and “…seconds” are mutually exclusive. |
| Time Display Format > Seconds: 0 | Selecting this tells Wireshark to display time stamps with a precision of one second. |
| Time Display Format > …seconds: 0… | Selecting this tells Wireshark to display time stamps with a precision of one second, decisecond, centisecond, millisecond, microsecond, or nanosecond. |
| Time Display Format > Display Seconds with hours and minutes | Selecting this tells Wireshark to display time stamps in seconds, with hours and minutes. |
| Name Resolution > Edit Resolved Name | This item allows you to manually enter names to resolve IP addresses in the current packet. |
| Name Resolution > Enable for MAC Layer | This item allows you to control whether or not Wireshark translates MAC addresses into names. |
| Name Resolution > Enable for Network Layer | This item allows you to control whether or not Wireshark translates network addresses into names. |
| Name Resolution > Enable for Transport Layer | This item allows you to control whether or not Wireshark translates transport addresses into names. |
| Colorize Packet List | This item allows you to control whether or not Wireshark should colorize the packet list. Enabling colorization will slow down the display of new packets while capturing or loading capture files. |
| Auto Scroll in Live Capture | This item allows you to specify that Wireshark should scroll the packet list pane as new packets come in, so you are always looking at the last packet. If you do not specify this, Wireshark simply adds new packets to the end of the list but does not scroll the packet list pane. |
| Zoom In | Zoom into the packet data (increase the font size). |
| Zoom Out | Zoom out of the packet data (decrease the font size). |
| Normal Size | Set the zoom level back to 100% (set font size back to normal). |
| Resize All Columns | Resize all column widths so the content will fit into it. Resizing may take a significant amount of time, especially if a large capture file is loaded. |
| Displayed Columns | This menu item folds out with a list of all configured columns. These columns can now be shown or hidden in the packet list. |
| Expand Subtrees | This menu item expands the currently selected subtree in the packet details tree. |
| Collapse Subtrees | This menu item collapses the currently selected subtree in the packet details tree. |
| Expand All | Wireshark keeps a list of all the protocol subtrees that are expanded and uses it to ensure that the correct subtrees are expanded when you display a packet. This menu item expands all subtrees in all packets in the capture. |
| Collapse All | This menu item collapses the tree view of all packets in the capture list. |
| Colorize Conversation | This menu item brings up a submenu that allows you to color packets in the packet list pane based on the addresses of the currently selected packet. This makes it easy to distinguish packets belonging to different conversations. |
| Colorize Conversation > Color 1-10 | These menu items enable one of the ten temporary color filters based on the currently selected conversation. |
| Colorize Conversation > Reset coloring | This menu item clears all temporary coloring rules. |
| Colorize Conversation > New Coloring Rule | This menu item opens a dialog window in which a new permanent coloring rule can be created based on the currently selected conversation. |
| Coloring Rules | This menu item brings up a dialog box that allows you to color packets in the packet list pane according to the filter expressions you choose. It can be very useful for spotting certain types of packets. |
| Internals | Information about various internal data structures. |
| Conversation Hash Tables | Shows the tuples (address and port combinations) used to identify each conversation. |
| Dissector Tables | Shows tables of sub-dissector relationships. |
| Supported Protocols | Displays supported protocols and protocol fields. |
| Show Packet in New Window | Shows the selected packet in a separate window. The separate window shows only the packet details and bytes. |
| Reload | This menu item allows you to reload the current capture file. |
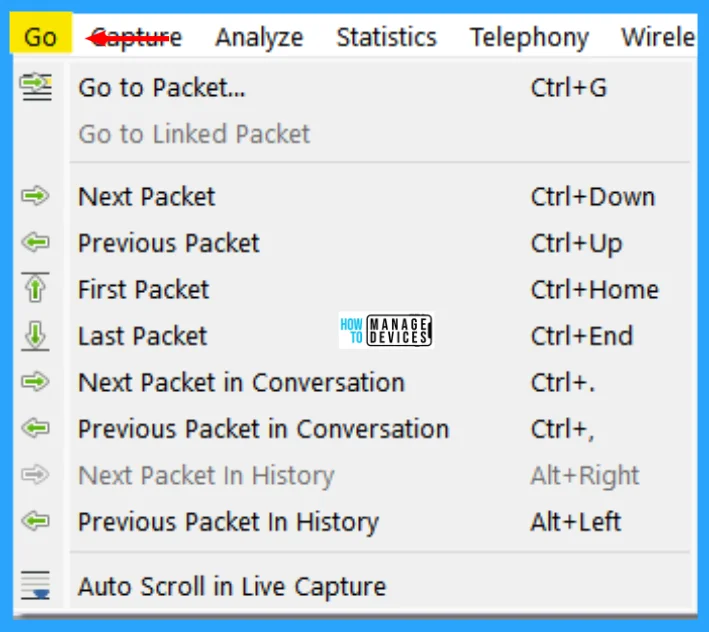
Go Menu
This menu contains items to go to a specific packet. The Wireshark Go menu contains the fields shown in the table below.
| Menu Item | Description |
|---|---|
| Back | Jump to the recently visited packet in the packet history, much like the page history in a web browser. |
| Forward | Jump to the next visited packet in the packet history, much like the page history in a web browser. |
| Go to Packet | Bring up a window frame that allows you to specify a packet number, and then go to that packet. |
| Go to Corresponding Packet | Go to the corresponding packet of the currently selected protocol field. If the selected field doesn’t correspond to a packet, this item is greyed out. |
| Previous Packet | Move to the previous packet in the list. This can be used to move to the previous packet even if the packet list doesn’t have keyboard focus. |
| Next Packet | Move to the next packet in the list. This can be used to move to the previous packet even if the packet list doesn’t have keyboard focus. |
| First Packet | Jump to the first packet of the capture file. |
| Last Packet | Jump to the last packet of the capture file. |
| Previous Packet-In Conversation | Move to the previous packet in the current conversation. This can be used to move to the previous packet even if the packet list doesn’t have keyboard focus. |
| Next Packet-In Conversation | Move to the next packet in the current conversation. This can be used to move to the previous packet even if the packet list doesn’t have keyboard focus. |
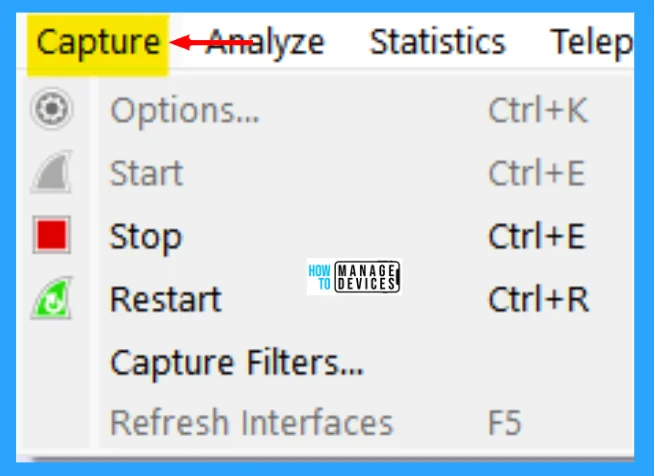
Capture Menu
This menu allows you to start and stop captures and edit capture filters. The Wireshark Capture menu contains the fields shown in the table below.
| Menu Item | Description |
|---|---|
| Options | Shows the Capture Options dialog box, which allows you to configure interfaces and capture options. |
| Start | Immediately starts capturing packets with the same settings as the last time. |
| Stop | Stops the currently running capture. |
| Restart | Stops the currently running capture and starts it again with the same options. |
| Capture Filters | Shows a dialog box that allows you to create and edit capture filters. You can name filters and save them for future use. |
| Refresh Interfaces | Clear and recreate the interface list. |
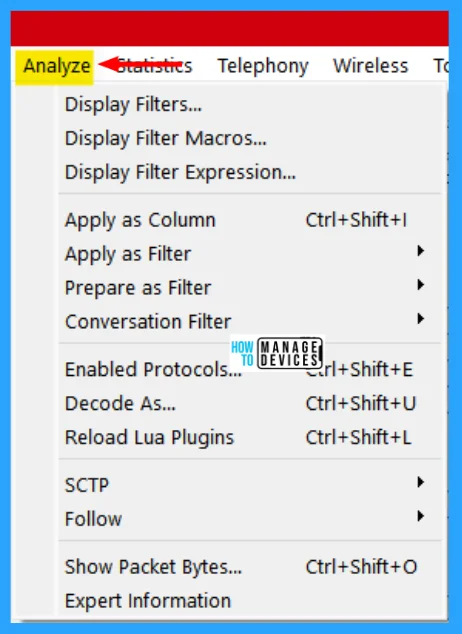
Analyze Menu
This menu contains items to manipulate display filters, enable or disable the dissection of protocols, configure user-specified decodes, and follow a TCP stream. The Wireshark Analyze menu contains the fields shown in the table below.
| Menu Item | Description |
|---|---|
| Display Filters | Displays a dialog box that allows you to create and edit display filters. You can name filters, and you can save them for future use. |
| Display Filter Macros | Shows a dialog box that allows you to create and edit display filter macros. You can name filter macros, and you can save them for future use. |
| Apply as Column | Adds the selected protocol item in the packet details pane as a column to the packet list. |
| Apply as Filter | Change the current display filter and apply it immediately. Depending on the chosen menu item, the current display filter string will be replaced or appended by the selected protocol field in the packet details pane. |
| Prepare as Filter | Change the current display filter but won’t apply it. Depending on the chosen menu item, the current display filter string will be replaced or appended by the selected protocol field in the packet details pane. |
| Conversation Filter | Apply a conversation filter for various protocols. |
| Enabled Protocols | Enable or disable various protocol dissectors. |
| Decode As | Decode certain packets as a particular protocol. |
| Follow > TCP Stream | Open a window that displays all the TCP segments captured that are on the same TCP connection as a selected packet. |
| Follow > UDP Stream | Same functionality as “Follow TCP Stream” but for UDP “streams”. |
| Follow > TLS Stream | Same functionality as “Follow TCP Stream” but for TLS or SSL streams. See the wiki page on TLS for instructions on providing TLS keys. |
| Follow > HTTP Stream | Same functionality as “Follow TCP Stream” but for HTTP streams. |
| Expert Info | Open a window showing expert information found in the capture. Some protocol dissectors add packet detail items for notable or unusual behavior, such as invalid checksums or retransmissions. Those items are shown here. |
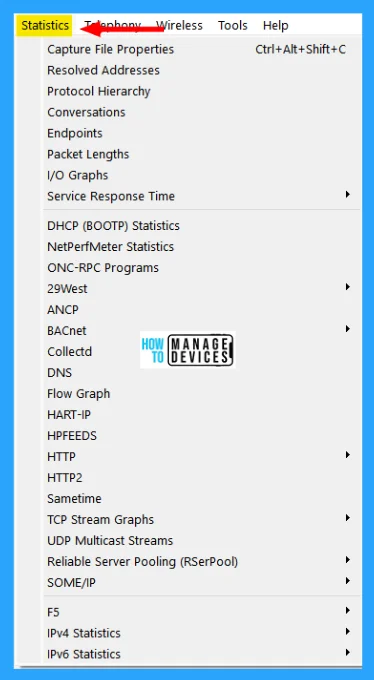
Statistics Menu
This menu contains items to display various statistic windows, including a summary of the packets that have been captured, display protocol hierarchy statistics, and much more. The Wireshark Statistics menu contains the fields shown in the table below.
| Menu Item | Description |
|---|---|
| Capture File Properties | Show information about the capture file. |
| Resolved Addresses | The Resolved Addresses window shows the list of resolved addresses and their host names. Users can choose the Hosts field to display IPv4 and IPv6 addresses only. |
| Protocol Hierarchy | Display a hierarchical tree of protocol statistics. |
| Conversations | Display a list of conversations (traffic between two endpoints). |
| Endpoints | Display a list of endpoints (traffic to/from an address). |
| Packet Lengths | Shows the distribution of packet lengths and related information |
| I/O Graphs | Display user-specified graphs, the number of packets in the course of time). |
| Service Response Time | Display the time between a request and the corresponding response. |
| DHCP (BOOTP) | The Dynamic Host Configuration Protocol (DHCP) is an option of the Bootstrap Protocol (BOOTP). It dynamically assigns IP addresses and other parameters to a DHCP client. The DHCP (BOOTP) Statistics window displays a table of the number of occurrences of a DHCP message type. The user can filter, copy, or save the data into a file. |
| NetPerfMeter | The NetPerfMeter Protocol (NPMP) is the control and data transfer protocol of NetPerfMeter, the transport protocol performance testing tool. It transmits data streams over TCP, SCTP, UDP, and DCCP with given parameters, such as frame rate, frame size, saturated flows, etc. |
| ONC-RPC Programs | Open Network Computing (ONC) Remote Procedure Call (RPC) uses TCP or UDP protocols to map a program number to a specific port on a remote machine and call a required service at that port. The ONC-RPC Programs window shows the description for captured program calls, such as the program name, its number, version, and other data. |
| 29West | The 29West technology now refers to Ultra-Low Latency Messaging (ULLM) technology. It allows sending and receiving a high number of messages per second with microsecond delivery times for zero-latency data delivery. |
| ANCP | The Access Node Control Protocol (ANCP) is a TCP-based protocol, that operates between an Access Node and a Network Access Server. The ANCP window shows the related statistical data. The user can filter, copy, or save the data into a file |
| BACnet | Building Automation and Control Networks (BACnet) is a communication protocol that provides control for various building automated facilities, such as light control, fire alarm control, and others. Wireshark provides the BACnet statistics which is a packet counter. You can sort packets by instance ID, IP address, object type, or service. |
| Collectd | Collectd is a system statistics collection daemon. It collects various statistics from your system and converts them for network use. The Collectd statistics window shows counts for values, which are split into type, plugin, and host as well as total packets counter. You can filter, copy, or save the data to a file. |
| DNS | The Domain Name System (DNS) associates different information, such as IP addresses, with domain names. DNS returns different codes, request responses, and counters for various aggregations. The DNS statistics window enlists a total count of DNS messages, which are divided into groups by request types (opcodes), response codes (rcode), query types, and others. |
| Flow Graph | The Flow Graph window shows connections between hosts. It displays the packet time, direction, ports, and comments for each captured connection. You can filter all connections by ICMP Flows, ICMPv6 Flows, UIM Flows, and TCP Flows. Flow Graph window is used for showing multiple different topics. Based on it, it offers different controls. |
| HART-IP | Highway Addressable Remote Transducer over IP (HART-IP) is an application layer protocol. It sends and receives digital information between smart devices and control or monitoring systems. The HART-IP statistics window shows the counter for response, request, publish, and error packets. You can filter, copy, or save the data to a file. |
| HPFEEDS | Hpfeeds protocol provides a lightweight authenticated publishing and subscription. It supports arbitrary binary payloads which can be separated into different channels. HPFEEDS statistics window shows a counter for payload size per channel and opcodes. You can filter, copy, or save the data to a file. |
| HTTP | HTTP request/response statistics. Statistics for HTTP request types and response codes. HTTP statistics based on the host and URI. HTTP request and response statistics based on the server address and host. HTTP Request Sequences uses HTTP’s Referer and Location headers to sequence a capture’s HTTP requests as a tree. This enables analysts to see how one HTTP request leads to the next. |
| HTTP2 | Hypertext Transfer Protocol version 2 (HTTP/2) allows multiplexing various HTTP requests and responses over a single connection. It uses a binary encoding which consists of frames. The HTTP/2 statistics window shows the total number of HTTP/2 frames and also provides a breakdown per frame type, such as HEADERS, DATA, and others. As HTTP/2 traffic is typically encrypted with TLS, you must configure decryption to observe HTTP/2 traffic. |
| Sametime | Sametime is a protocol for the IBM Sametime software. The Sametime statistics window shows the counter for message type, send type, and user status. |
| TCP Stream Graphs | Show different visual representations of the TCP streams in a capture. |
| UDP Multicast Streams | The UDP Multicast Streams window shows statistics for all UDP multicast streams. It includes source addresses and ports, destination addresses and ports, packet counters, and other data. You can specify the burst interval, the alarm limits, and output speeds. |
| Reliable Server Pooling (RSerPool) | The Reliable Server Pooling (RSerPool) windows show statistics for the different protocols of Reliable Server Pooling (RSerPool). |
| F5 | In F5 Networks, TMM stands for Traffic Management Microkernel. It processes all load-balanced traffic on the BIG-IP system. |
| IPv4 Statistics | Internet Protocol version 4 (IPv4) is a core protocol for the internet layer. It uses 32-bit addresses and allows packet routing from one source host to the next one. |
| IPv6 Statistics | Internet Protocol version 6 (IPv6) is a core protocol for the internet layer. It uses 128-bit addresses and routes internet traffic. |
Telephony Menu
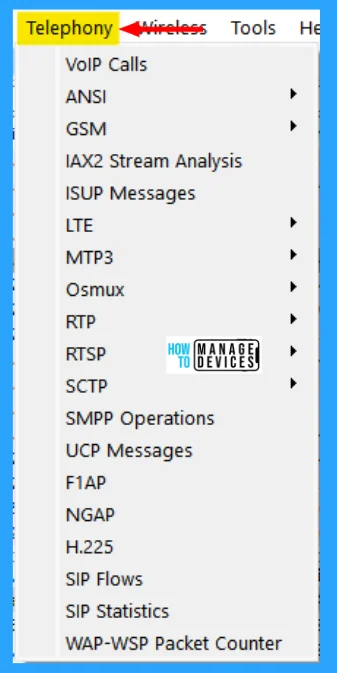
This menu contains items to display various telephony-related statistic windows, including a media analysis, flow diagrams, display protocol hierarchy statistics, and much more. The Wireshark Telephony menu contains the fields shown in the table below. Each menu item shows specific telephony-related statistics.
| Menu Item | Description |
|---|---|
| VoIP Calls | The VoIP Calls window shows a list of all detected VoIP calls in the captured traffic. It finds calls by their signaling and shows related RTP streams. |
| ANSI | This menu shows groups of statistical data for mobile communication protocols according to ETSI GSM standards. |
| GSM | The Global System for Mobile Communications (GSM) is a standard for mobile networks. This menu shows a group of statistical data for mobile communication protocols according to ETSI GSM standards. |
| IAX2 Stream Analysis | The IAX2 Stream Analysis window shows statistics for the forward and reverse streams of a selected IAX2 call along with a graph. |
| ISUP Messages | Integrated Service User Part (ISUP) protocol provides voice and non-voice signaling for telephone communications. ISUP Messages menu opens the window which shows the related statistics. The user can filter, copy, or save the data into a file. |
| LTE | Statistics of the captured LTE MAC traffic. This window will summarize the LTE MAC traffic found in the capture. |
| MTP3 | The Message Transfer Part level 3 (MTP3) protocol is a part of the Signaling System 7 (SS7). The Public Switched Telephone Networks use it for reliable, unduplicated, and in-sequence transport of SS7 messaging between communication partners. This menu shows MTP3 Statistics and MTP3 Summary windows. |
| Osmux | OSmux is a multiplex protocol designed to reduce bandwidth usage of satellite-based GSM systems’s voice (RTP-AMR) and signaling traffic. The OSmux menu opens the packet counter window with the related statistic data. The user can filter, copy, or save the data into a file. |
| RTP | The RTP streams window shows all RTP streams in the capture file. Streams can be selected there and on selected streams, other tools can be initiated. The RTP analysis function takes the selected RTP streams and generates a list of statistics on them including a graph. |
| RTSP | In the Real Time Streaming Protocol (RTSP) menu the user can check the Packet Counter window. It shows the Total RTCP Packets and is divided into RTSP Response Packets, RTSP Request Packets, and Other RTSP packets. The user can filter, copy, or save the data into a file. |
| SCTP | Stream Control Transmission Protocol (SCTP) is a computer network protocol that provides a message transfer in telecommunication in the transport layer. It overcomes some lack of User Datagram Protocol (UDP) and Transmission Control Protocol (TCP) |
| SMPP Operations | Short Message Peer-to-Peer (SMPP) protocol uses TCP protocol as its transfer for exchanging Short Message Service (SMS) Messages, mainly between Short Message Service Centers (SMSC). The dissector determines whether the captured packet is SMPP or not by using the heuristics in the fixed header. The SMPP Operations window displays the related statistical data. The user can filter, copy, or save the data into a file. |
| UCP Messages | The Universal Computer Protocol (UCP) plays a role in transferring Short Messages between a Short Message Service Centre (SMSC) and an application, that is using a transport protocol, such as TCP or X.25. The UCP Messages window displays the related statistical data. The user can filter, copy, or save the data into a file. |
| H.225 | H.225 telecommunication protocol which is responsible for messages in call signaling and media stream packetization for packet-based multimedia communication systems. The H.225 window shows the counted messages by type and reason. The user can filter, copy, or save the data into a file. |
| SIP Flows | Session Initiation Protocol (SIP) Flows window shows the list of all captured SIP transactions, such as client registrations, messages, calls, and so on. This window will list both complete and in-progress SIP transactions. |
| SIP Statistics | The SIP Statistics window shows captured SIP transactions. It is divided into SIP Responses and SIP Requests. In this window, the user can filter, copy, or save the statistics into a file. |
| WAP-WSP Packet Counter | The WAP-WSP Packet Counter menu displays the number of packets for each Status Code and PDU Type in Wireless Session Protocol traffic. The user can filter, copy, or save the data into a file. |
Wireless Menu
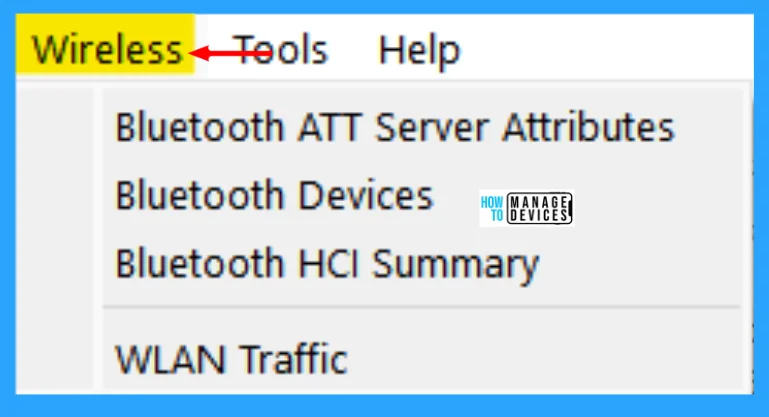
This menu contains items to display Bluetooth and IEEE 802.11 wireless statistics. The Wireless menu lets you analyze Bluetooth and IEEE 802.11 wireless LAN activity as shown in the image below and described in the table. Each menu item shows specific Bluetooth and IEEE 802.11 statistics.
| Menu Item | Description |
|---|---|
| Bluetooth ATT Server Attributes | Bluetooth ATT Server Attributes window displays a list of captured Attribute Protocol (ATT) packets. The user can filter the list by the interfaces or devices, and also exclude repetitions by checking the Remove Duplicates check box. |
| Bluetooth Devices | The Bluetooth Devices window displays the list of the captured information about devices, such as MAC address, Organizationally Unique Identifier (OUI), Name, and others. |
| Bluetooth HCI Summary | The Bluetooth HCI Summary window displays the summary for the captured Host Controller Interface (HCI) layer packets. This window allows users to apply filters and choose to display information about specific interfaces or devices. |
| WLAN Traffic | Statistics about captured WLAN traffic. This can be found under the Wireless menu and summarizes the wireless network traffic found in the capture. Probe requests will be merged into an existing network if the SSID matches. |
Tools Menu
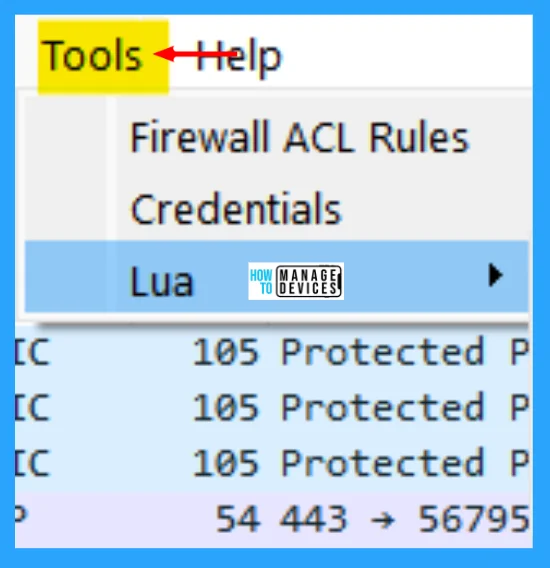
This menu contains various tools available in Wireshark, such as creating Firewall ACL Rules. The Wireshark Tools menu contains the fields shown in the table below.
| Menu Item | Description |
|---|---|
| Firewall ACL Rules | This allows you to create command-line ACL rules for many different firewall products, including Cisco IOS, Linux Netfilter (iptables), OpenBSD pf, and Windows Firewall (via netsh). Rules for MAC addresses, IPv4 addresses, TCP and UDP ports, and IPv4+port combinations are supported. It is assumed that the rules will be applied to an outside interface. The menu item is greyed out unless one (and only one) frame is selected in the packet list. |
| Credentials | This allows you to extract credentials from the current capture file. Some of the dissectors (ftp, http, imap, pop, smtp) have been instrumented to provide the module with usernames and passwords and more will be instrumented in the future. The window dialog provides you the packet number where the credentials have been found, the protocol that provided them, the username, and protocol-specific information. |
| Lua Console | This option allows you to work with the Lua interpreter optionally built into Wireshark, to inspect Lua internals and evaluate code. See “Lua Support in Wireshark” in the Wireshark Developer’s Guide. |
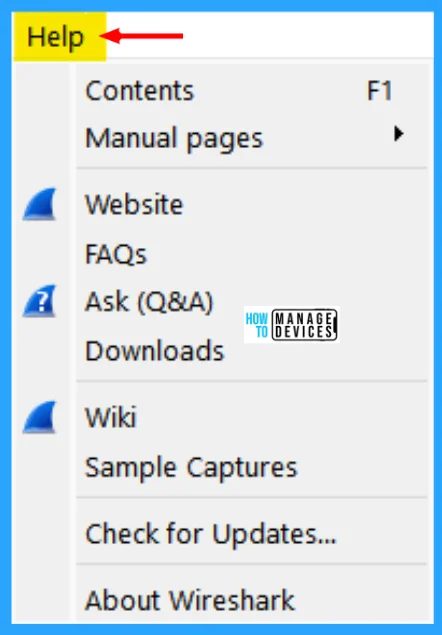
Help Menu
This menu contains items to help the user, e.g., access to some basic help, manual pages of the various command line tools, online access to some of the webpages, and the usual about dialog. The Wireshark Help menu contains the fields shown in the table below.
| Menu Item | Description |
|---|---|
| Contents | This menu item brings up a basic help system. |
| Manual Pages | This menu item starts a Web browser showing one of the locally installed html manual pages. |
| Website | This menu item starts a Web browser showing the webpage from: https://www.wireshark.org/. |
| FAQs | This menu item starts a Web browser showing various FAQs. |
| Downloads | This menu item starts a Web browser showing the downloads from: https://www.wireshark.org/download.html. |
| Wiki | This menu item starts a Web browser showing the front page from: https://gitlab.com/wireshark/wireshark/-/wikis/. |
| Sample Captures | This menu item starts a Web browser showing the sample captures from: https://gitlab.com/wireshark/wireshark/-/wikis/SampleCaptures. |
| About Wireshark | This menu item brings up an information window that provides various detailed information items on Wireshark, such as how it’s built, the plugins loaded, and the used folders. |
The Main Toolbar
The main toolbar provides quick access to frequently used items from the menu. This toolbar cannot be customized by the user, but it can be hidden using the View menu if the space on the screen is needed to show more packet data.
Items in the toolbar will be enabled or disabled similar to their corresponding menu items. Various file-related buttons are enabled, but the stop capture button is disabled because capture is not in progress. As shown in the table & image below the main window toolbar.

| Serial No. | Items | Items Present in Menu | Description |
|---|---|---|---|
| 1 | Start | Capture > Start | Starts capturing packets with the same options as the last capture or the default options if none were set. |
| 2 | Stop | Capture > Stop | Stops the currently running capture. |
| 3 | Restart | Capture > Restart | Restart the current capture session. |
| 4 | Options | Capture > Options | Opens the “Capture Options” dialog box. |
| 5 | Open | File > Open | Opens the file open dialog box, which allows you to load a capture file for viewing. |
| 6 | Save As | File > Save As | Save the current capture file to whatever file you would like. If you currently have a temporary capture file open the “Save” icon will be shown instead. |
| 7 | Close | File > Close | Closes the current capture. If you have not saved the capture, you will be asked to save it first. |
| 8 | Reload | View > Reload | Reloads the current capture file. |
| 9 | Find Packet | Edit > Find Packet | Find a packet based on different criteria. |
| 10 | Go Back | Go > Go Back | Jump back in the packet history. Hold down the Alt key to go back in the selection history. |
| 11 | Go Forward | Go > Go Forward | Jump forward in the packet history. Hold down the Alt key (Option on macOS) to go forward in the selection history. |
| 12 | Go to Packet | Go > Go to Packet | Go to a specific packet. |
| 13 | Go To First Packet | Go > First Packet | Jump to the first packet of the capture file. |
| 14 | Go To Last Packet | Go > Last Packet | Jump to the last packet of the capture file. |
| 15 | Auto Scroll in Live Capture | View > Auto Scroll in Live Capture | Auto-scroll packet list while doing a live capture (or not). |
| 16 | Colorize | View > Colorize | Colorize the packet list (or not). |
| 17 | Zoom In | View > Zoom In | Zoom into the packet data (increase the font size). |
| 18 | Zoom Out | View > Zoom Out | Zoom out of the packet data (decrease the font size). |
| 19 | Normal Size | View > Normal Size | Set the zoom level back to 100%. |
| 20 | Resize Columns | View > Resize Columns | Resize columns, so the content fits into them. |
The Filter Toolbar
The filter toolbar lets you quickly edit and apply display filters. Wireshark has two filtering languages capture filters and display filters.
Capture filters are used for filtering when capturing packets. Wireshark supports limiting the packet capture to packets that match a capture filter. Wireshark capture filters are written in libpcap filter language.
Display filters are used for filtering which packets are displayed. Display filters allow you to concentrate on the packets you are interested in while hiding the currently uninteresting ones. They allow you to only display packets based on protocols, presence of field, comparison of field, etc.

| Toolbar Icon | Name | Description |
|---|---|---|
| Bookmarks | Manage or select saved filters. | |
| 1 | Filter Input | For the area to enter or edit a display filter string. A syntax check of your filter string is done while you are typing. The background will turn red if you enter an incomplete or invalid string, and will become green when you enter a valid string. After you’ve changed something in this field, don’t forget to press the Apply button (or the Enter/Return key), to apply this filter string to the display. This field is also where the current applied filter is displayed. |
| 2 | Clear | Reset the current display filter and clear the edit area. |
| 3 | Apply | Apply the current value in the edit area as the new display filter. Applying a display filter on large capture files might take quite a long time. |
| 4 | Recent | Select from a list of recently applied filters. |
| 5 | Add Button | Add a new filter button. |
I hope the Detailed Overview of Wireshark in Windows 11 information is helpful. Please follow us on the HTMD Community and visit our website HTMD Forum, if you like our content. Suggest improvements, if any, and we love to know which topic you want us to explore next.
We are on WhatsApp. To get the latest step-by-step guides and news updates, Join our Channel. Click here – HTMD WhatsApp.
Author
Alok is a Master of Computer Applications (MCA) graduate. He loves writing on Windows 11 and related technologies. He likes to share his knowledge, quick tips, and tricks with Windows 11 or Windows 10 with the community.


