Hey, let’s discuss how to Enable Remote Debugging to Control User Access and Permissions for Microsoft Edge using Intune. The remote debugging policy decides if users can fix problems on a computer from another location. If it is enabled or not configured, users can start remote debugging using the commands –remote-debug-port and –remote-debugging-pipe. If it is disabled, no one can use remote debugging.
The remote debugging policy is important because it controls whether users can debug applications from another computer or location. Remote debugging can be useful for developers and IT teams to identify and fix problems without physically being at the machine.
This makes troubleshooting faster and more efficient, especially in large or distributed environments. Without such a policy, remote debugging might be used without restrictions, which could create unnecessary risks. By enabling or disabling it, admins can decide who has permission to use remote debugging features.
When allowed, remote debugging can save time and resources because developers and IT support can fix issues without travelling to the physical location of the machine. At the same time, having the ability to disable it when not needed helps protect the organisation’s systems from potential cyber threats.
Table of Contents
What are the Advantages of enabling Remote Debugging Policy using Intune?
The remote debugging policy in Intune lets admins control who can debug systems remotely, helping fix issues quickly while keeping devices secure from unauthorised access.
1. Enables quick problem-solving without physical access.
2. Improves security by allowing only trusted users.
3. Reduces downtime during troubleshooting.
4. Ensures consistent policy across all devices.
5. Prevents misuse of debugging tools.
Allow or Block Remote Debugging using Intune Policy
Before enabling the remote debugging policy, any user could potentially attempt remote debugging if the system allowed it. This created a higher risk of unauthorised access, misuse of debugging tools, and possible exposure of sensitive system information. Troubleshooting often requires physical access to the device, which could delay problem resolution.
After enabling the remote debugging policy, only authorised users can run remote debugging sessions. This increases security by preventing unapproved access and misuse, while also allowing faster problem-solving since issues can be fixed remotely without visiting the device in person.
- Best Guide to Deploy and Update Visual Studio Code using Intune
- Enable or Disable Auto Deletion of Memory Dumps on Low Disk Space in Windows 11
- Easy Way to Create a Compliance Policy for Android Devices in Intune
Create a Profile
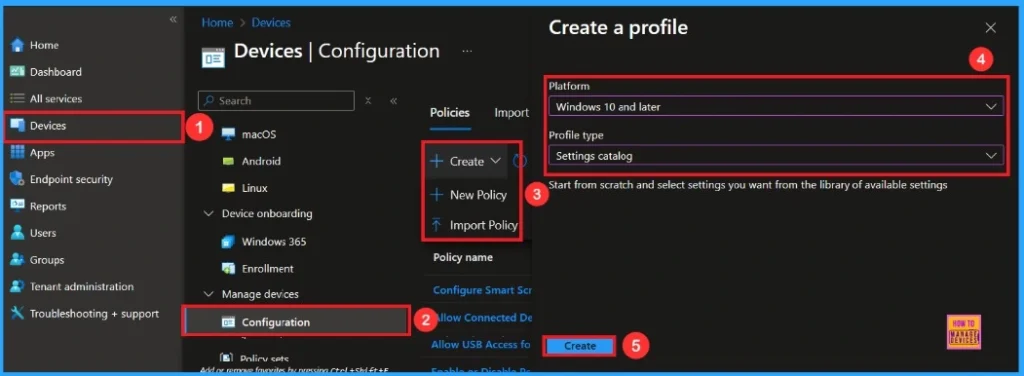
Using simple steps, you can easily complete the policy creation. Open the Intune admin center. Go to Devices > Configuration > Policies> + Create > + New policy. After that, you will get a profile window to select the platform and profile type. First of all, you select the platform, then you can select the profile type. Select Windows 10 and later as the platform, and select settings catalog as the profile type. Click on the create button.
Basic Tag
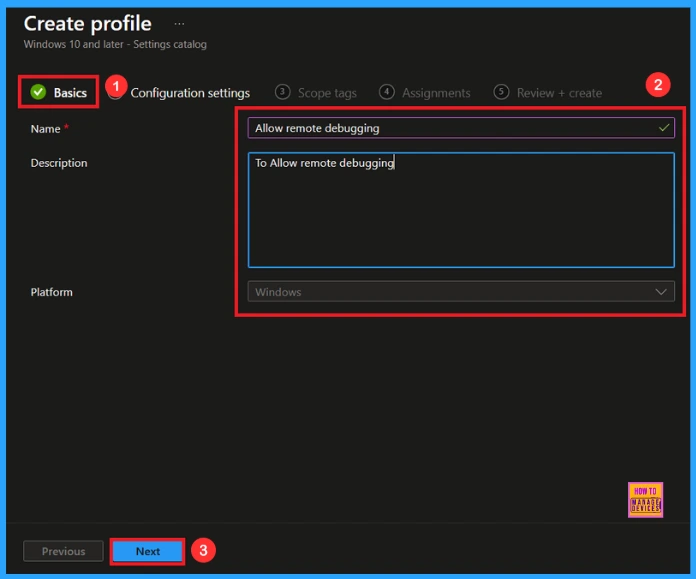
On this tab, you have to give a name for the policy that you want to create. The name field is mandatory. Without giving a name, you can’t create a policy on the basic tab. You can also describe the policy, which description is not mandatory. Click on the next button.
Configuration Settings
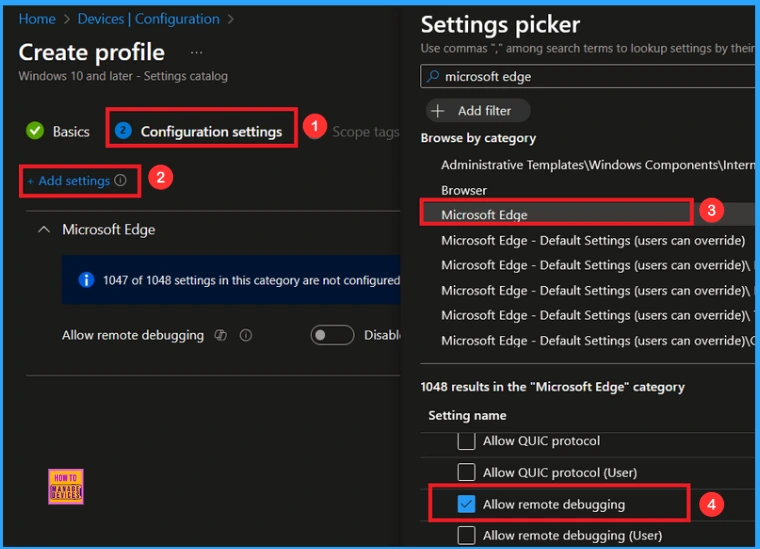
The configuration tab allows you to select specific policy settings to manage your organisation’s devices. On this page, we click on the + Add Settings hyperlink. Then you will get a settings picker that will show different types of categories to select specific settings. Here, I choose the Microsoft Edge category and select Allow Remote Debugging.
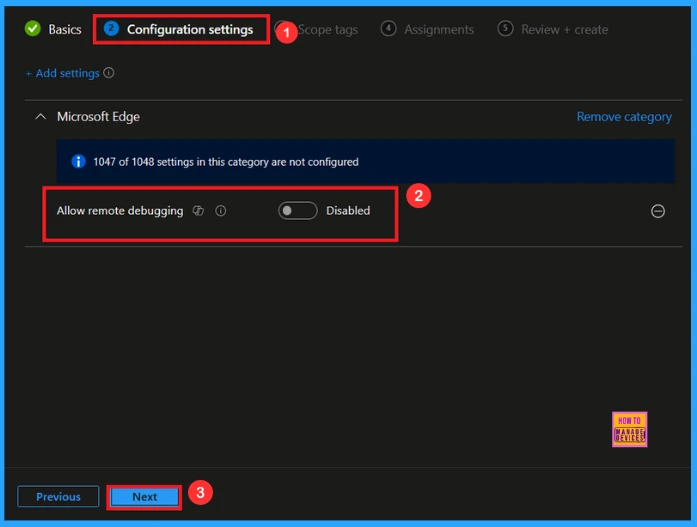
Once you have selected the Allow Remote Debugging policy, and closed the Settings picker. You will see it on the Configuration page. Here we have only two settings: Enable or Disable. By default, the Remote Debugging Policy will be set to Disable. Click Next to continue.
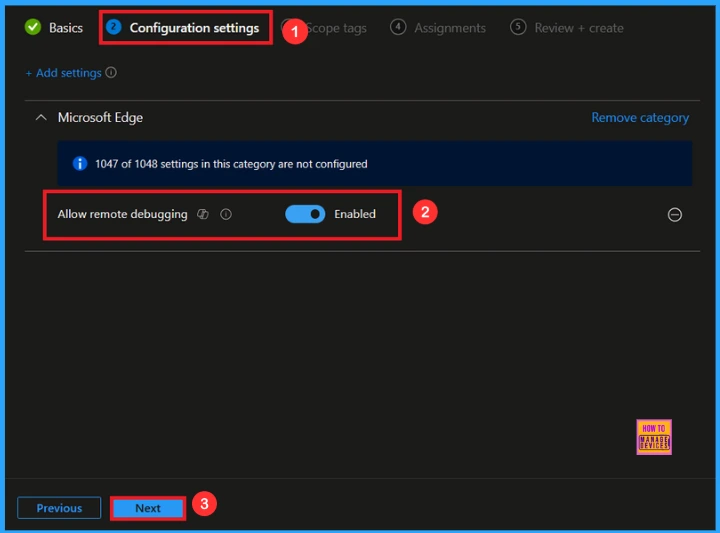
If we allow or configure this policy, you can block the Remote Debugging Policy by toggling the switch. Then add a File name and value there. After reviewing or adding more settings, you can click the Next button to proceed.
Scope Tags
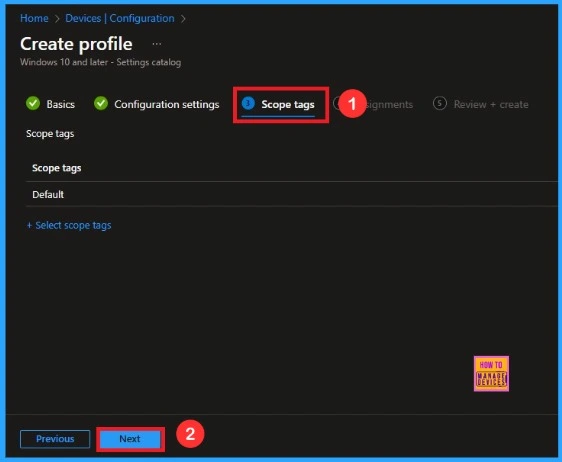
In Intune, Scope Tags are used to control who can view and modify a policy. The scope tag is not mandatory, so you can skip this section. It functions as a tool for organisation and access management, but assigning it is optional. Click Next if they’re not required for your setup.
Assignments
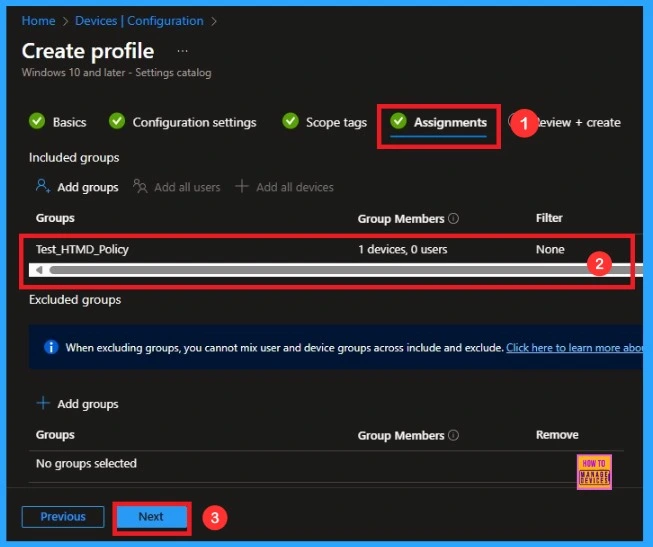
In this step, you have to decide which group you want to deploy the policy to. First, click on Add groups under the Include groups section, and select the group to which you want to apply the policy. Then, click Next to continue.
Final Step
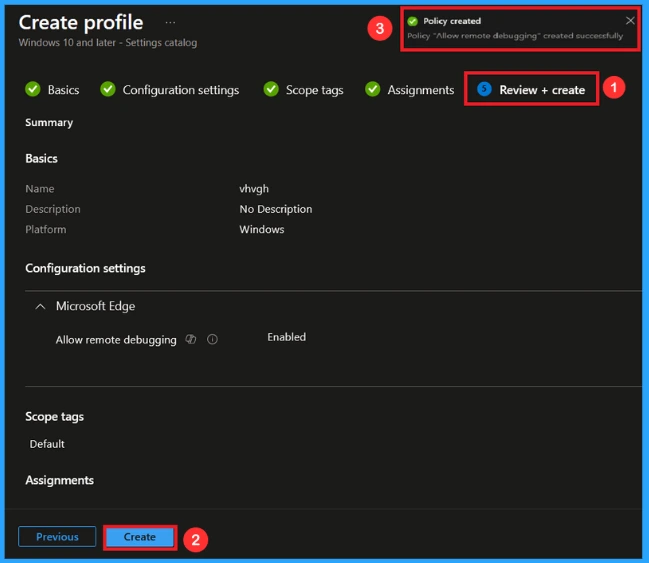
Review + Create is the final step in the policy creation process. You will reach this section after completing the Assignment step. This section acts like a summary page, showing all the steps you have previously completed. If everything looks correct, click on the Create button.
Device and User Check-in Status for the Policy
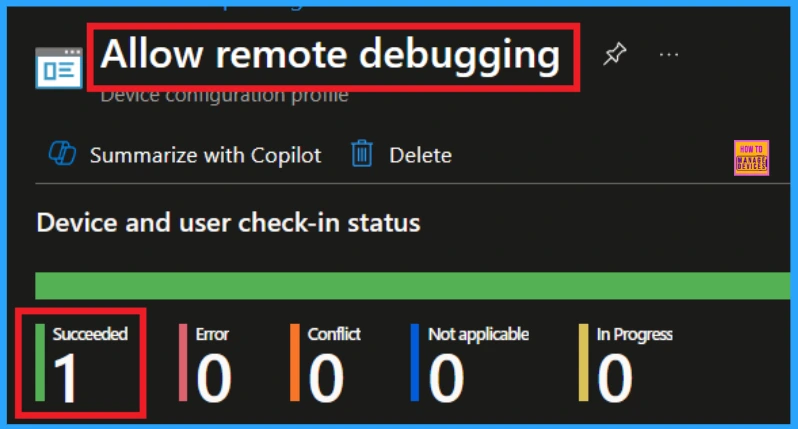
After creating a policy, the main concern is whether the policy has been deployed successfully or not. As you know, the policy creation takes an 8-hour waiting period. I sync the policy through the company portal and then check the monitoring status.
- Open the Microsoft Intune admin portal.
- Then Navigate to the Devices> Configurations.
- In the configurations, select the policy you created
- You will then be able to view the monitoring status.
Client-Side Verification
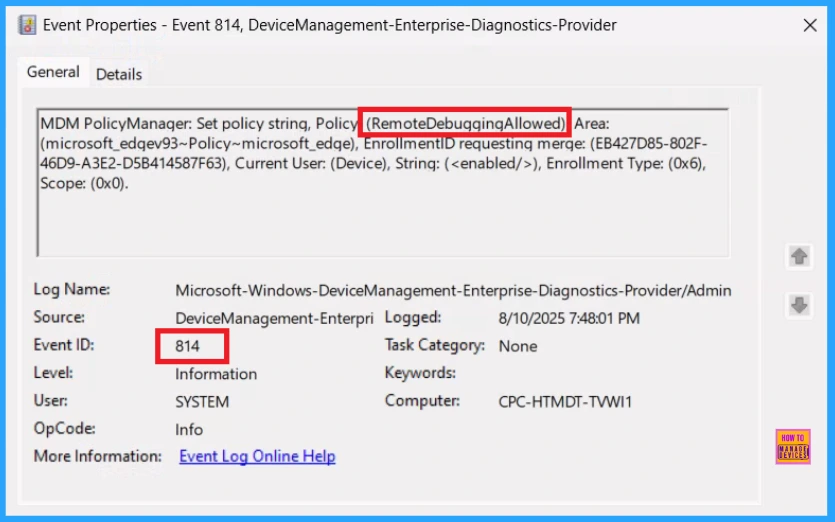
The next confirmation of the Policy’s success or not is by checking the client-side verification. First, go to the Event Viewer and check the Event ID 814. Navigate to Applications and Services Logs > Microsoft > Windows > Device Management > Enterprise Diagnostic Provider > Admin.
MDM PolicyManager: Set policy string, Policy (RemoteDebuggingAllowed) Area:
(microsoft_edqev93~Policy~microsoft_edqe), EnrollmentID requesting merqe: (EB427D85-802F-
46D9-A3E2-D5B414587F63), Current User: (Device), Strinq: (), Enrollment Type: (0x6),
Scope: (0x0).
How to Remove a Group from Remote Debugging Policy
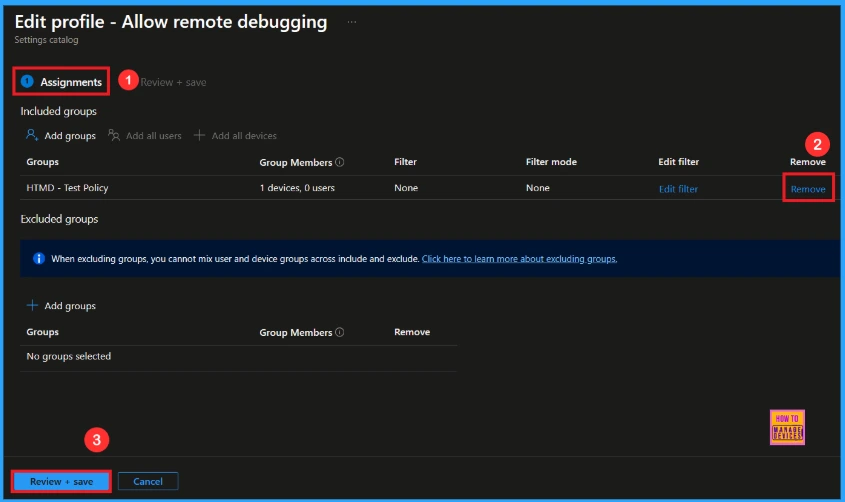
Intune allows you to easily remove the Group. To do this, open the policy from the Configuration tab and click on the Edit button on the Assignment tab. Click on the Remove button in this section to remove the policy.
For more detailed information, you can check our previous post – Learn How to Delete or Remove App Assignment from Intune using by Step-by-Step Guide.
How to Delete Remote Debugging from Intune
If you want to delete the Policy, first go to the Device >Configurations section. In the Policy section, search for the Policy name that you entered. Once you find the policy in the list, click on the 3-dot menu next to it. From the options that appear, select Delete to remove the policy.
For More Information review the post: How to Delete Allow Clipboard History Policy in Intune Step by Step Guide

Need Further Assistance or Have Technical Questions?
Join the LinkedIn Page and Telegram group to get the latest step-by-step guides and news updates. Join our Meetup Page to participate in User group meetings. Also, Join the WhatsApp Community to get the latest news on Microsoft Technologies. We are there on Reddit as well.
Author
Anoop C Nair has been Microsoft MVP from 2015 onwards for 10 consecutive years! He is a Workplace Solution Architect with more than 22+ years of experience in Workplace technologies. He is also a Blogger, Speaker, and Local User Group Community leader. His primary focus is on Device Management technologies like SCCM and Intune. He writes about technologies like Intune, SCCM, Windows, Cloud PC, Windows, Entra, Microsoft Security, Career, etc.

