Easy Way to Measure Data Size Sent Between SCCM ConfigMgr Servers? Are you trying to analyze the data sent between Sccm / ConfigMgr CAS and Primary servers (Central server and Primary server)? The easiest way I can see this is via Performance Monitor.
In this post, I’ll show you how to monitor data sent between SCCM / ConfigMgr sites (2007 and 2012). Before proceeding, I would like to mention that this wouldn’t provide a very accurate result. However, you’ll learn the trend, which will surely help you troubleshoot.
In this post, you will find detailed steps on how to easily measure the data size sent between SCCM (System Center Configuration Manager) servers. The process involves monitoring network performance, capturing and analyzing network traffic, and utilizing SCCM’s built-in monitoring and reporting tools.
This post is also related to my other posts on performance monitoring. 1) Download ConfigMgr 2012 Performance Counter Template and 2) SCCM ConfigMgr 2007 / 2012 How to Find Out DDRs Processing Rate.
Table of Contents
Easy Way to Measure Data Size Sent Between SCCM ConfigMgr Servers
To measure the data sent between SCCM sites from a central site (or CAS), we need to use a performance monitor counter called SMS Standard Sender.
This will help you determine how much data is sent across the WAS from SCCM / ConfigMgr CAS to Primary servers. This is apart from SQL replication in SCCM 2012.
In the scenario below, you can see that the central server is transferring ~1.3 GB of data to child or primary servers.
- ConfigMgr Performance Counter Template SCCM
- ConfigMgr SCCM How to Find Out DDRs Processing Rate
- How to Change Size of Desktop Icon in Windows 11
- Free SCCM Training Part 1 | 17 Hours Of Latest Technical Content | ConfigMgr Lab HTMD Blog
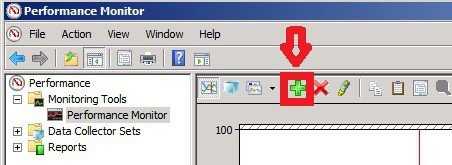
1. Launch Administrative Tools – Performance Monitor. Press Green “+” button to add SMS Standard Sender counters.
2. Select all the counters available underneath SMS Standard Sender:
- Average Bytes / Sec: Average Bytes per second that the SCCM central server is sending to child servers.
- Current Bytes Being Sent: Currently in process
- Sending Thread Count: How many SCCM threads are being used for sending?
- Total Bytes Attempted
- Total Bytes Failed
- Total Bytes Sent
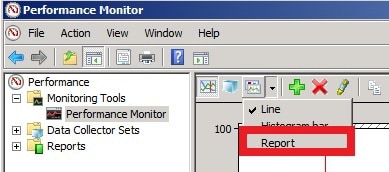
3. Change the settings to Report as shown in the screen capture below.
| Performance Monitor |
|---|
| Performance |
| Performance Monitor |
| Report |
4. Result shown in the report below.
All the measurements are in bytes. For example – Total Bytes Sent from my CAS (Central SCCM / ConfigMgr server to Primary or Child servers) = 1409968961 bytes
1048576 Bytes = 1 MB (mega Bytes)
1409968961 Bytes = 1409968961 / 1048576 ==> ~1344.65 MB ==> 1.3 GB
So the data sent out from my CAS (Central SCCM site to Child site) is around 1.3 GB. Wow, so much data, right? Don’t show these details to the network team, and they will get worried 🙂
We are on WhatsApp now. To get the latest step-by-step guides, news, and updates, Join our Channel. Click here – HTMD WhatsApp.
Author
Anoop C Nair is Microsoft MVP! He is a Device Management Admin with more than 20 years of experience (calculation done in 2021) in IT. He is a Blogger, Speaker, and Local User Group HTMD Community leader. His primary focus is Device Management technologies like SCCM 2012, Current Branch, and Intune. He writes about ConfigMgr, Windows 11, Windows 10, Azure AD, Microsoft Intune, Windows 365, AVD, etc.


1.3gb over what amount of time?
It was over a week it seems. I don’t remember the exact duration. I had some big packages flowing down.
hello Anoop i need small help if you share your mobile number My self ashu Maheshwari workswith ITC as a lead consultant with architect the same in SCCM. My email id is ashumaheshwari30@gmail.com
OK, please reach me at anoopmannur”attherate”gmailDOTcom
Nice article.