Let’s try to check the details of the Tenant Attach dashboard (a.k.a Co-management dashboard) in the SCCM console. Interestingly, Microsoft renamed the co-management node to Cloud Attach. However, some parts of the SCCM 2107 console still have Co-management nodes.
SCCM 2107 provides out of box dashboard for Co-management devices. There are options to find out eligible devices for co-management as well. The co-management feature that one of the primary ways to attach your existing SCCM deployment to the Microsoft 365 cloud.
Tenant Attach Dashboard
The Tenant dashboard helps you review machines that are co-managed in the SCCM environment. The dashboard can help identify devices that might need attention. There are five sections available in the dashboard. The list of 5 sections of the Co-management dashboard is given below.
- Client OS Distribution
- Co-Management Status
- Co-Management Enrollment Status
- Enrollment Errors
- Workloads managed by Intune
How to Launch Tenant Attach Dashboard
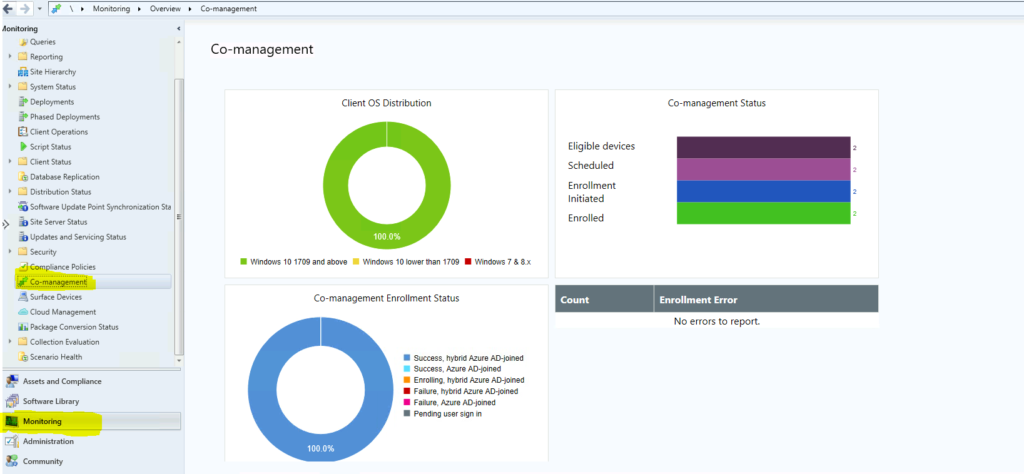
You can launch a co-management dashboard from the SCCM console itself. You don’t see any data in this dashboard if you have not enabled the Co-Management feature. Let’s follow the steps mentioned below:
- Launch CofigMgr Console
- Navigate \Monitoring\Overview\Co-management
Client OS Distribution
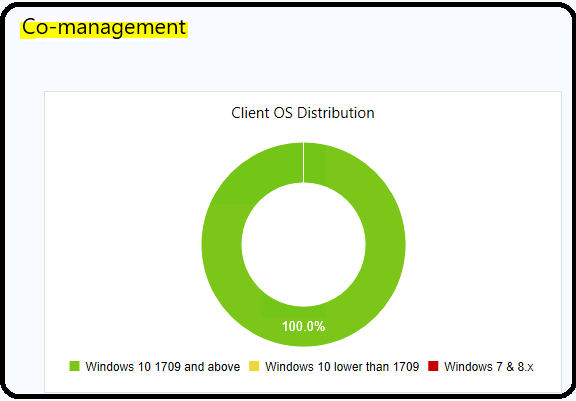
The client OS distribution section of the co-management (a.k.a tenant attach) dashboard gives you an idea about the OS versions and supported versions of Windows 10 for the co-management scenarios. I can see three segregation of operating systems here in this section.
- Windows 10 1709 and above (Green in color because it’s supported OD version).
- Windows 10 lower than 1709 (Yellow in color because it’s not supported but you can do an inplace upgrade to make it supported).
- Windows 7 and 8.x (Red in color because it’s not supported at all)
Co-Management Status
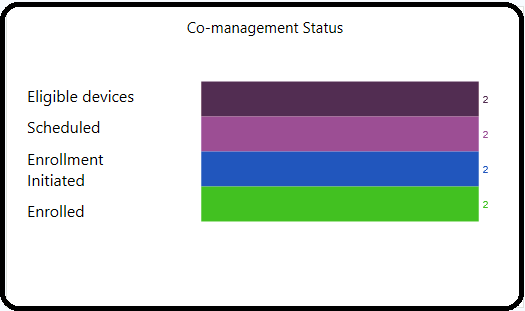
The co-management status section gives you an idea about different categories of devices from the supported scenario explained above. So, this section is a subset of the GREEN section of devices listed in the above section. Let’s check what the four segregations available in this section are.
- Eligible Devices -> 2
- Scheduled Devices -> 2
- Enrollment Initiated Devices -> 2
- Enrolled Device (which is shown in GREEN color) -> 2
NOTE! – For me, it shows 2 devices in all the categories, and that was a bit confusing. I think the better way to represent is the current status of the co-management or Tenant Attach. Ideally, it should show zero against all the categories except Enrolled. Isn’t it?
Tenant Attach Enrollment Status
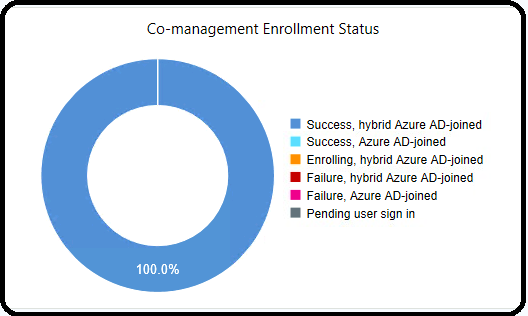
The tenant attach enrollment status section of the dashboard gives more idea about different enrollment scenarios. There are six different categories shown in this section of the dashboard. I think this is pretty useful, and I love the color code given to this section. Azure AD joined scenario gets GREEN color, which shows Microsoft gives utmost importance to that AAD Join scenario.
- Success -> Hybrid Azure AD Joined Devices -> 100% in my lab.
- Success -> Azure AD Joined Devices.
- Enrolling -> Hybrid Azure AD Joined Devices.
- Failure -> Hybrid Azure AD Joined Devices.
- Failure -> Azure AD Joined devices.
- Pending user sign-in.
NOTE! – I like the last category called Pending user sign-in scenarios. This helps us with a lot of troubleshooting options.
Workloads Managed by Intune
You can see the workloads moved to Intune (MEM) from this dashboard section. I have explained more about moving the workloads to Intune in the following post. More details – ConfigMgr Co-Management Workload Client Apps | SCCM.
- Compliance policies
- Device configuration
- Endpoint Protection
- Resource access policies
- Client apps
- Office Click-to-Run apps
- Windows Update policies
- Disk encryption
- Intune enrolled without a workload


