Let’s start learning how to Troubleshoot the SCCM Task Sequence Debugger. The tool can be launched by right-clicking on Task Sequence and clicking SCCM Task Sequence Debugger.
Starting with the SCCM 2203, the Task Sequence debugger features are no longer pre-release.
This post will discuss a Microsoft Endpoint Configuration Manager tool, a “Task sequence debugger,” which helps with the above challenges.
I presented this topic at the “How To Manage Devices” event on 14th Dec.
Related Post from Vishal on SMSTS.log magic – https://www.anoopcnair.com/sccm-osd-task-sequence-ultimate-guide/
What are the Challenging Tasks Faced by the Windows 10 Admins Who Manage the Task Sequence?
Most Windows 10 admins who manage task sequences go through the challenging tasks below.
Analyze the task sequence logic: In the Task sequence, we spend a lot of time defining scripts to trace the execution flow. Some of the common writings we include are adding pause, waiting for action, exporting task sequence variable values to a text file, etc.
Troubleshooting: Watch the events, Task sequence variables, and logs when the task sequence is in action
Testing time: If the task sequence fails, we must start over again. We do not have any control over it. This includes manually copying the logs to an external disk and analyzing them.
Prerequisites – SCCM Task Sequence Debugger
Let’s check prerequisite checks for the SCCM Task Sequence Debugger feature.
- Task Sequence Debugger feature enabled.
- Go to Administration / Updates and Servicing / Features
- Right-click and select Turn-on on the Task Sequence Debugger feature
- The logged in user should be a member of the Local Administrators group
- SCCM server version 1906 and above
- Updated SCCM client and boot image
How to enable Task Sequence Debugger?
As shown below Task sequence debugger is an inbuilt tool with an SCCM agent. There is no need to add this tool. We need to trigger the device to launch along with the Task Sequence.
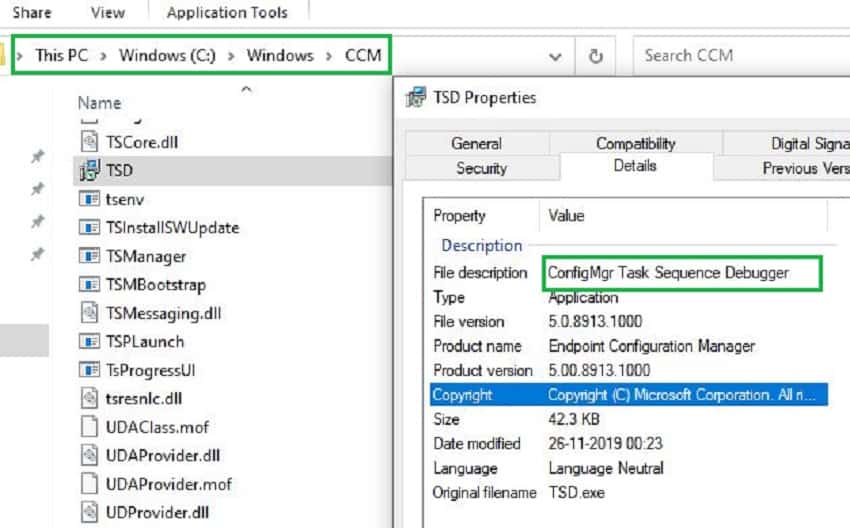
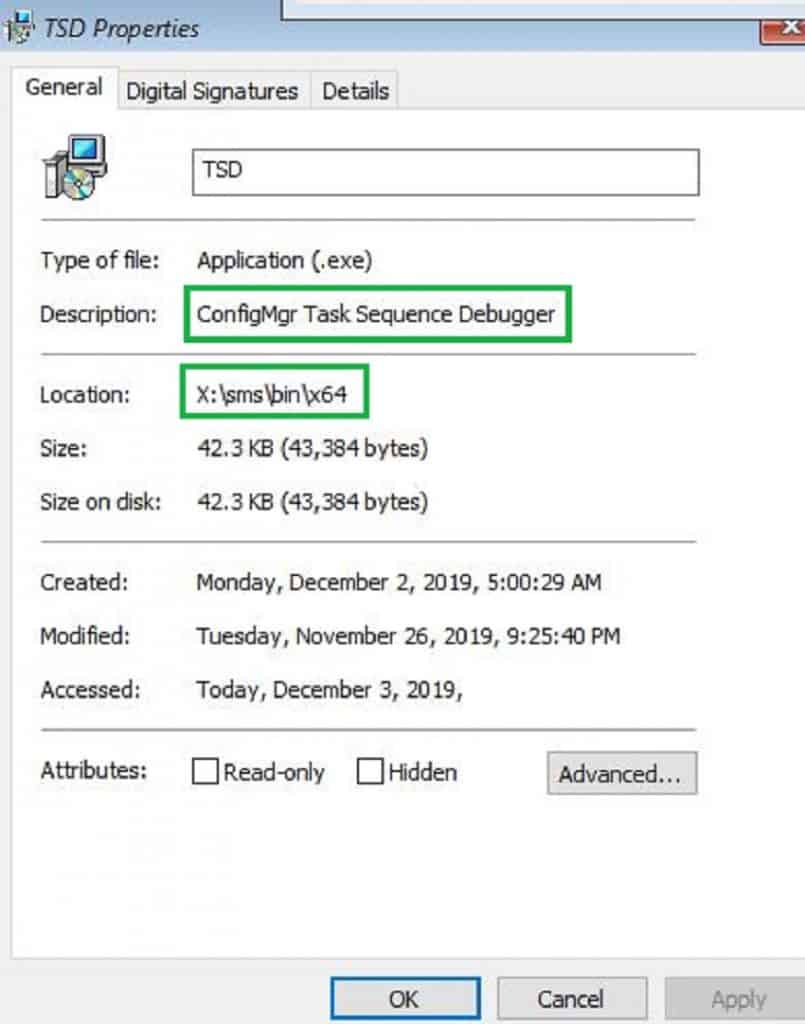
In the case of Win PE, You can find the tool within X:\SMS\bin\x64
Option 1: Task Sequence Debug deployment
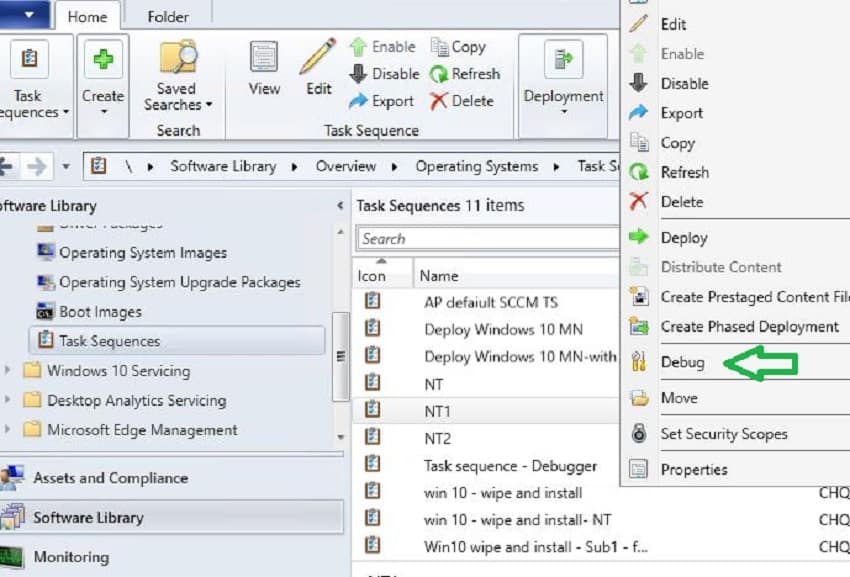
We can trigger the Task Sequence debugger in 2 ways. Option 1: Debug deployment.
- · Navigate to Software Library / Operating Systems / Task Sequences
- · Right-Click the Task Sequence. Select Debug in the menu and deploy
Note 1: You cannot deploy the debug mode Task Sequence to collections with more than ten computers. SCCM will automatically hide the groups with more than 10 computers.
Note 2: You cannot deploy the debug Task Sequence in “Required” mode. Only the “available” deployment mode is supported.
Note 3: The Debugger tool may not work if you deploy normal and debug packages to the same computer.
Option 2: Variables – SCCM Task Sequence Debugger
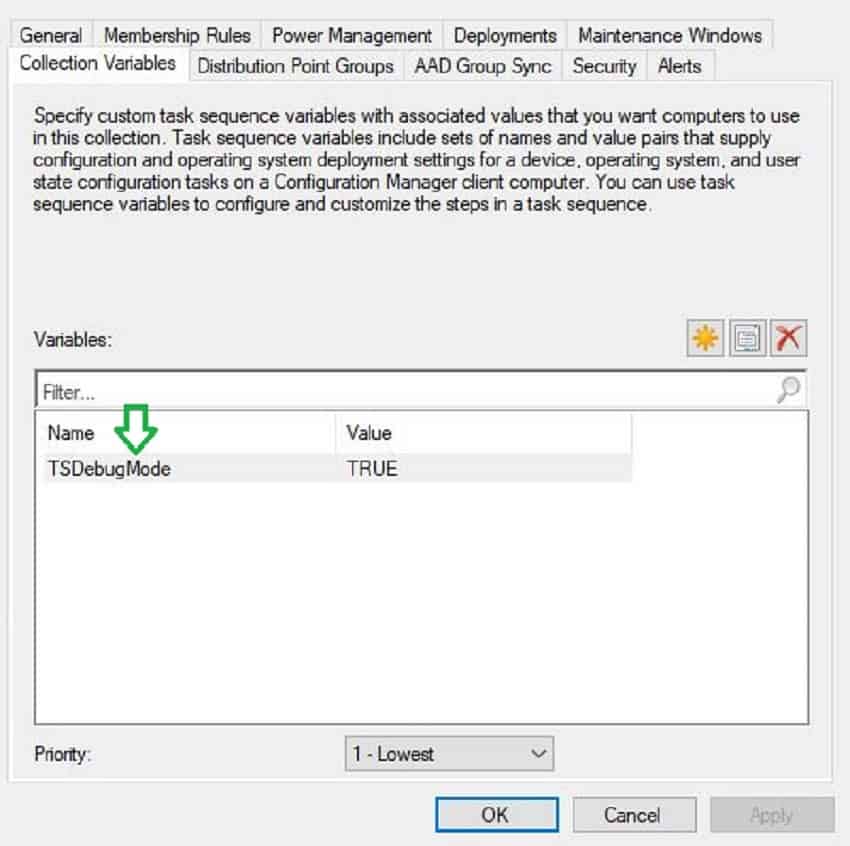
Enable SCCM variable “TSDebugMode”. You can set this variable for a particular machine or the entire collection. The collection variable is shown below.
As shown below, I prefer setting variables at the device level instead of collecting variables because I know exactly which are my test devices in SCCM.
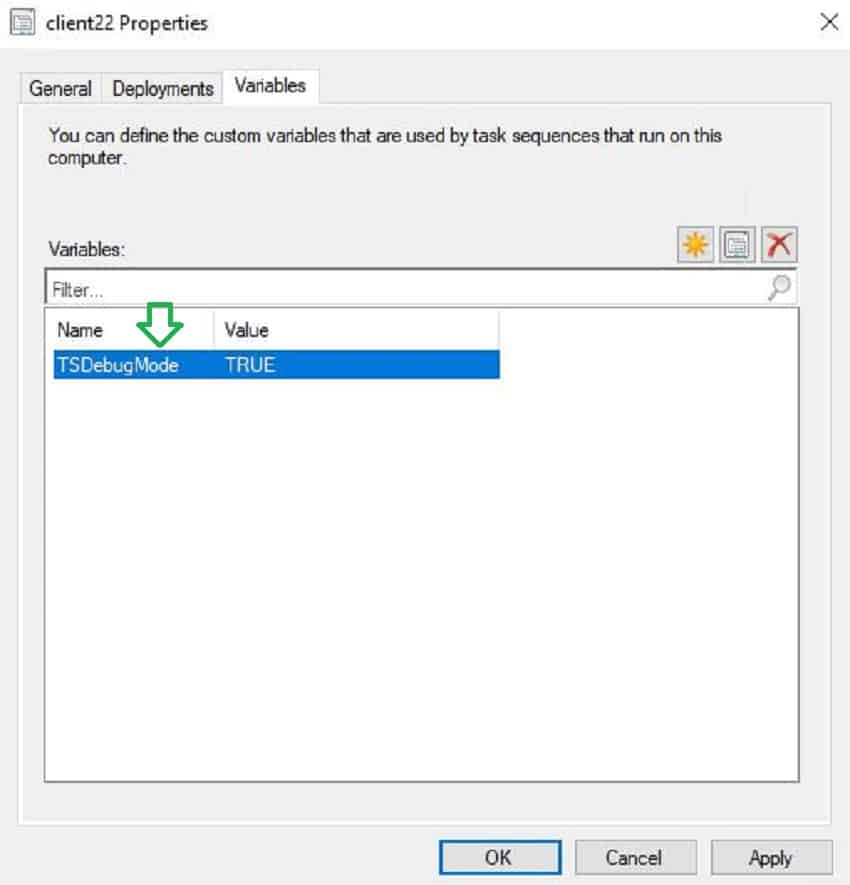
Please do not enable the debug mode variable on collections that include end-user computers. End-user is not required to see the tool.
How to use the Task Sequence Debugger Tool
Now let us discuss the different controls available in the debugger tool
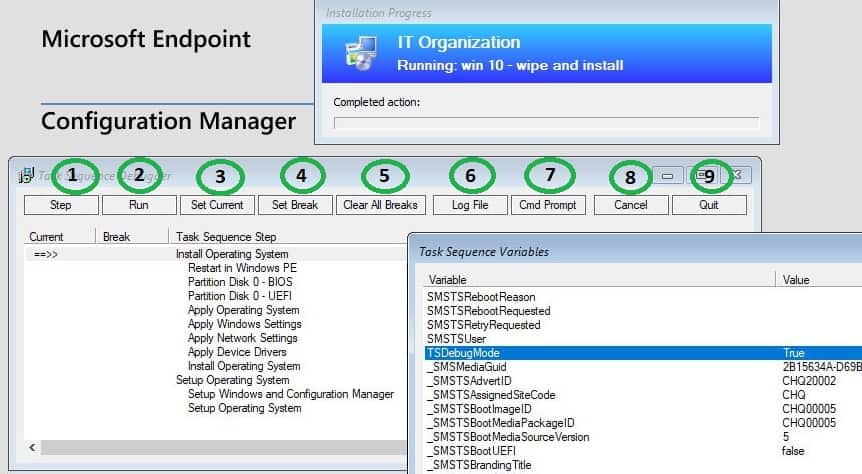
- Step: This will execute one step at a time. After one step, TS will stop. After each step, you will get the opportunity to check the logs, variables, etc.
- Run: This will allow your Task sequence to execute normally without Debugger tool controls.
- Set current: This allows you to jump or move the control of the task sequence step to another step you want. You do not need to re-run the entire TS. This allows a lot of flexibility while troubleshooting. You can identify the current step with the symbol ( ==>> ), as shown in the picture below.
Set break: This lets you set stop points in the Task sequence. The task sequence will execute until the step where we put the breakpoint. It will not proceed further until we release the break. This is useful when you suspect a particular stage in the Task sequence is causing an issue.
As shown below, TS will proceed till the step is marked STOP and halts there. You can set multiple breakpoints in the TS. The action that the Task sequence is currently executing will be displayed as (==>>)
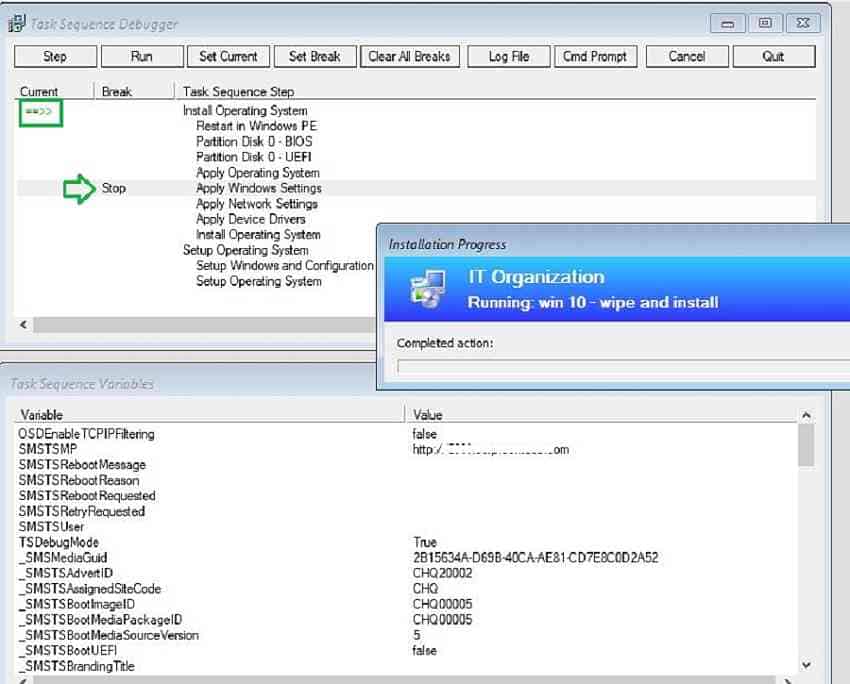
Note: After restart, all the breakpoints configured are removed automatically. However, a Task sequence will pause after any restart Task Sequence. So you can set back the breakpoint.
- Clear all breaks: This removes all breaks that you set earlier.
- Logfile: This launches the SMSTS log with the Cmtrace log viewer.
- Cmd prompt: This will launch the command prompt support. This is helpful when checking external dependencies like IP address, DNS, network, etc.
- Cancel: This will stop both Task Sequence and debugging tools.
- Quit: This will quit only the debugger tool. However, the Task sequence will resume in normal mode.
How to launch TS debugger only when TS fails
You can use the task sequence variable “TSDebugOnError” to launch the Debugger tool only when the task sequence fails. If you use the “TSDebugOnError” variable, you do not have to define the other variable “TSdebugmode”.
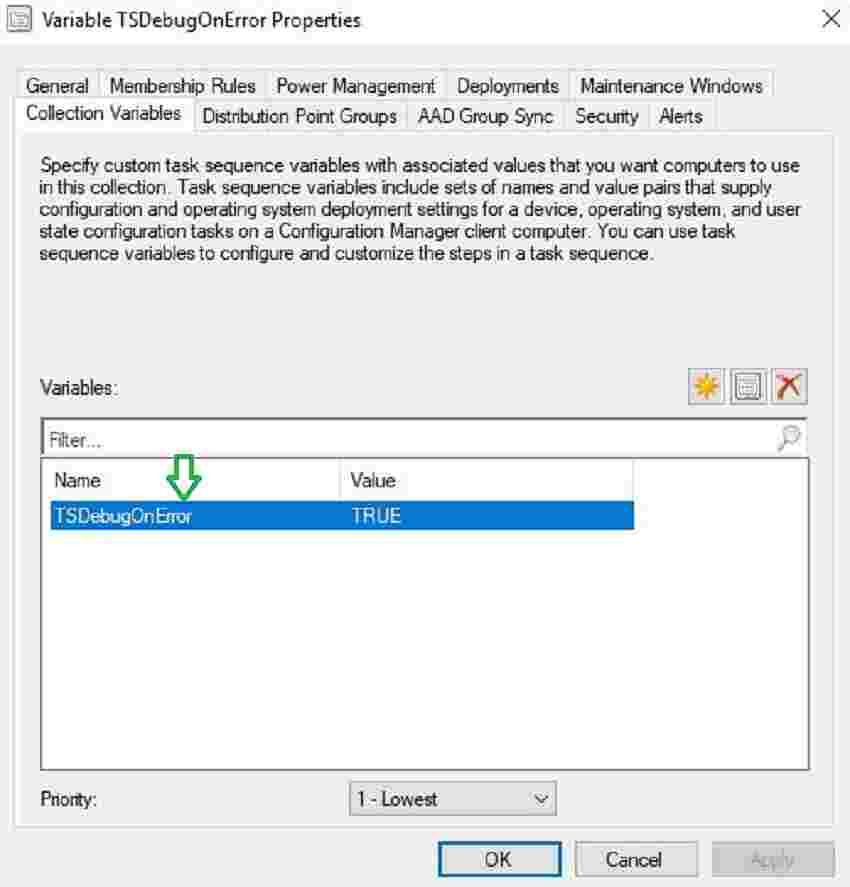
SCCM version 1910 added the “TSDebugOnError” variable. If the task sequence fails, you can still control it and play with it using the Debugger tool.
Conclusion: How to Troubleshoot SCCM Task Sequence Debugger
This tool is primarily meant for debugging, but it also helps to improve Task sequence logic, scripts, design, and performance, reduce reboots, etc.
Let’s hope Microsoft adds more capabilities in the future, such as automatic recommendations based on insights for the task sequence.
Start using the Task Sequence debugger tool if you have not yet started.
Resources
- SCCM Debug options – Debug a task sequence – https://docs.microsoft.com/en-us/configmgr/osd/deploy-use/debug-task-sequence
We are on WhatsApp. To get the latest step-by-step guides and news updates, Join our Channel. Click here –HTMD WhatsApp.
Author
Vimal Das has over 10 years of experience in SCCM device management solutions. His main focus is on Device Management technologies like Microsoft Intune, ConfigMgr (SCCM), OS Deployment, and Patch Management. He writes about SCCM, Windows 10, Microsoft Intune, and MDT.
