Proper case documentation not only helps in appropriate case management for the case owner but also helps to understand the case and its status better when it moves up the support hierarchy levels (L1 > L2 > L3). This helps to reduce the overall TAT of a case due to less time spent on things that would otherwise be wasted due to the below points.
Gathering all the necessary information from the end-user in the initial communication would prevent the need for multiple follow-up communications. Avoiding redundant steps or procedures by the higher-level team requires clear documentation of what has been completed and its results.
The other important aspect of providing a seamless support experience is proper data (log) collection. When a case moves up the support hierarchy without proper or relevant logs, it certainly does not help the end user or the next-level support engineer. Setting up comms with the end-user to retrieve the necessary logs wastes time and increases the case age and TAT.
Where case documentation is like a habitual practice, relevant log collection requires knowledge and a clear understanding of the product – the underlying concepts and a clear overview of how things work.
– Joymalya Basu Roy
- How to Troubleshoot Windows 11 10 Intune MDM Issues
- MDM Diagnostics Tool – Tips & Tricks
- Troubleshoot Windows Autopilot Issues with MDM Diagnostics Tool
Windows 10 MDM Log Checklist
For mobile devices (Android and iOS), in most cases, an Intune Administrator has to work only with the profile deployment status from the Intune portal to help troubleshoot issues before contacting MS Support.
MDM log generation and analysis for Android and/or iOS devices managed by Intune are somewhat limited. The native MDM log collection is facilitated via the Company Portal app, which collects the MDM log, silently uploads the collected log to the MS log database in the background, and provides a unique identifier to identify the uploaded logs to MS support.
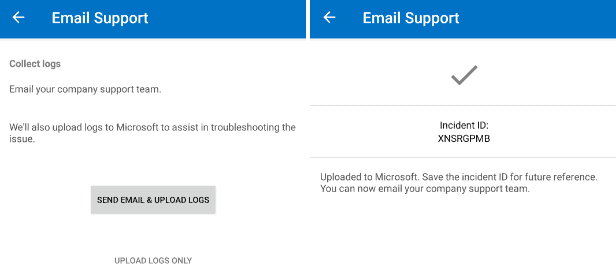
The MDM log itself remains hidden from the end-user. [Not really. As for Android, you can still access it—more on this in a later post!].
But when it comes to Windows 10, it’s an entirely different story.
Windows 10 does not restrict an Intune Administrator with the limitation of possible client end checks as in the case for mobile platforms, only if you know
- what to look for and
- where to look for,
With Windows 10, there is no Company Portal log, but you have a similar option to get Management logs, which we term the MDM Diagnostic logs.
However, what is more relevant is that you have the entire Windows Registry and Events at your disposal for tracking and tracing issues related to Intune management.
I have split the content into a two-post series wherein
- Part 1– Today, we will discuss the Windows 10 client-end verification to check for policy deployments from Intune and the different log collection options that Windows has available.
- Part 2 (coming soon, stay tuned!): We will walk through the Windows registry to check information related to Intune management and policy deployments, necessary Event paths, and specific individual log file locations.
So let’s get started.
Ultimate Help Guide–Windows 10 MDM Log Checklist
This is all about the Windows 10 client-end check to validate policy deployment from Intune and the different log collection options available in Windows 10.
Check the policies as received.
The first place to check the policies as received on a Windows 10 endpoint is from the Work Account Info.
Settings > Account > Access work or school > Work Account > Info
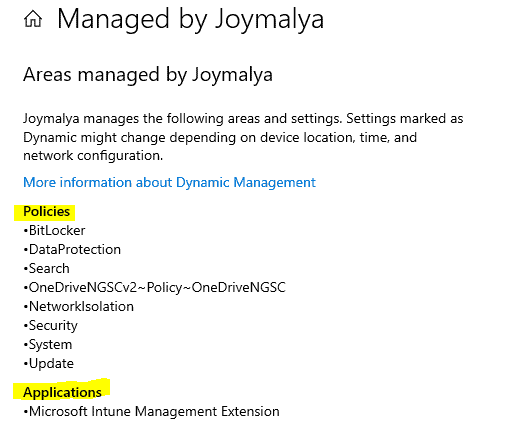
Here, you can see an overview of all the policies (Configuration profiles and MSI applications) delivered to the device by Intune.
Note #1: The overview gives you information about the feature that the policy controls, not the policy name as you configured in the portal.
Note #2 This does not include win32 and PS script deployments from Intune.
If the policy status in Intune shows as Pending and you do not see the same under managed policies, check the device SYNC status.
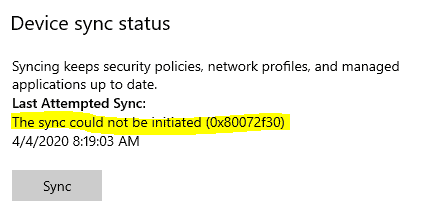
If there are any network-related issues (mostly common if the device is in the intranet or restricted networks), verify with the network team whether the device can communicate to the required endpoints. Check the Intune network requirements as listed here.
However, if you can see that the device has received the policy for the particular feature, you can move to the next part, which is
Generate a simple MDM Diagnostic Report
The Create Report button on the Info page of the Work Account generates a simple MDM report.
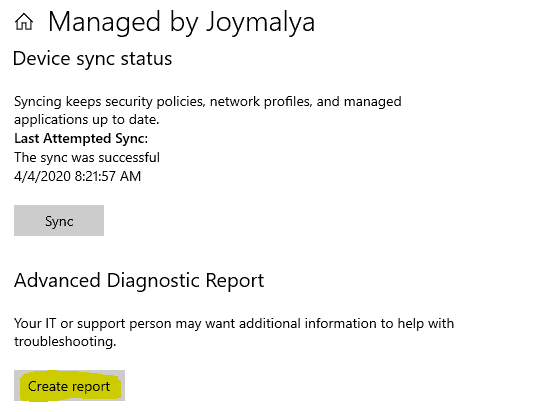
This creates an HTML report file (MDMDiagReport.html) that can be found at the location. C:\Users\Public\Documents\MDMDiagnostics
Reviewing MDMDiagReport.html
The file can be viewed with any browser. Here, we are more interested in looking under the Managed policies header to check what policy settings Intune has delivered to the device. You will see the policy’s Default Value and the policy-enforced value, which is reflected under the Current Value.
This can be your starting check to confirm if the policy settings as configured in the Intune portal are what is being delivered to the device or not.
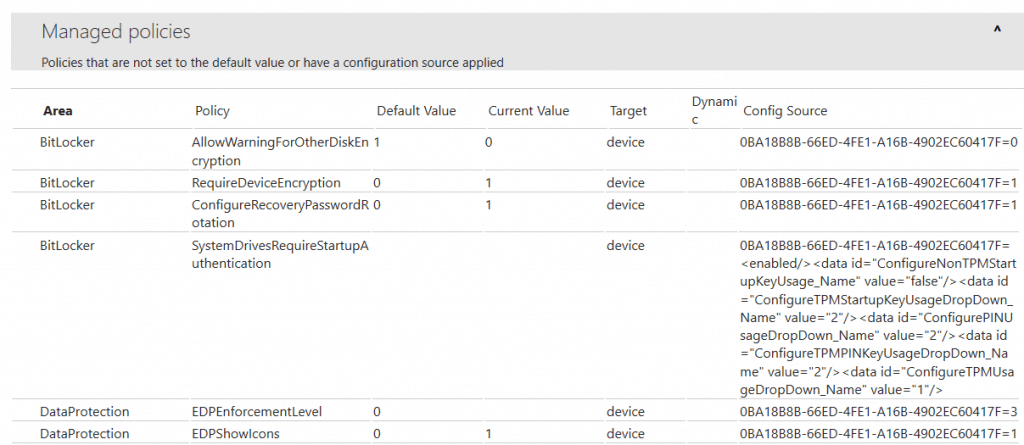
If the Current Value does not match or follow what has been set in the portal, it is an Intune service-related issue, as it is not delivering the policy settings configured.
However, if you see the policy settings have been correctly delivered, then it is up to the respective Configuration Service Providers (CSP) to implement the same. In such a case, if the policy state is in Error, you need to check a bit further – the event logs for the same.
Generate a Detailed MDM Diagnostic Report
Export your management log files from Access work or school display without entering the Work Account.
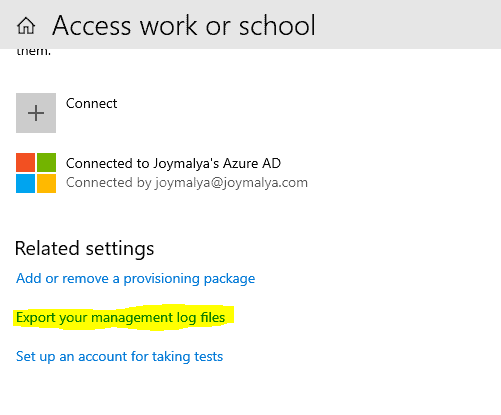
This results in a cab file (MDMDiagReport.cab) at the exact location C:\User”Pu”ic\Documents\MDMDiagnostics, which you can extract using any tool like 7Zip/WinRAR.
An alternative to this is to use the CLI to trigger the MDMDiagnosticTool. Open a command prompt with admin rights and use the command.
MdmDiagnosticsTool.exe -area <area name(s)> -cab <output cab file path>
The”area“names are defined in the registry at HKEY_LOCAL_MACHINE\SOFTWARE\Microsoft\MdmDiagnostics\Area However, you need specific knowledge of the issue to determine which area to use.
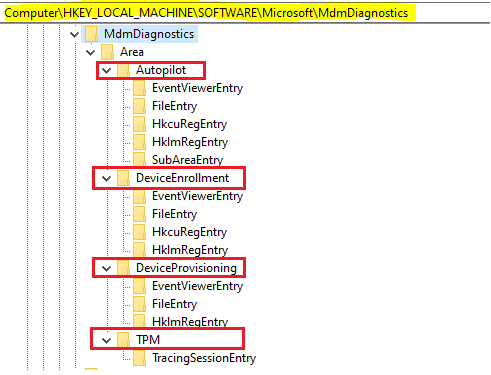
The resulting cab file will contain all the events and logs particular to the area as specified during log collection. If you want to review the logs as collected, check out this blog post by Vimal Das.
Intune One Data Collector
Intune ODC is a master log collection tool that covers all the aspects of Intune.
This is a custom tool from Microsoft designed to collect various files, registry keys, and command-line output to assist support engineers in troubleshooting Intune issues. Suppose you have experience working with Microsoft Support for any Windows 10-related issue. In that case, you might have encountered this name, as it is standard for an MS Support Engineer to request ODC logs in several scenarios.
The tool is freely available on GitHub and can be used even without opening an MS Support Case (Offline Standalone)
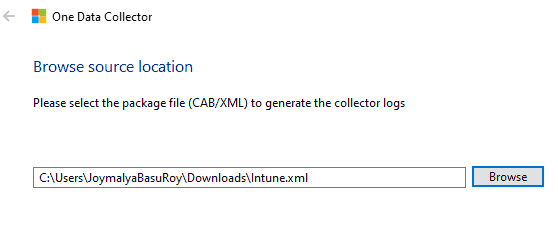
- Navigate to this link and save the entire site content as Intune.xml
- Download the tool (Direct download link)
- Double-click on 1dc-c.diagcab to launch the troubleshooter and click on Next to continue
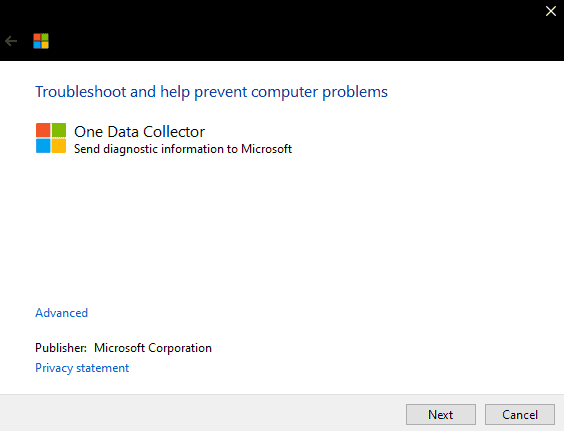
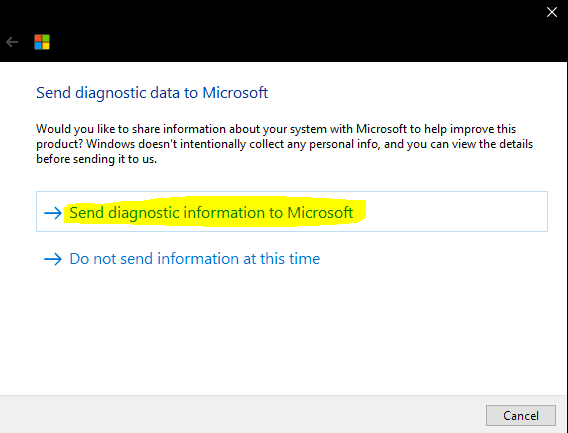
Choose to send diagnostic information to Microsoft when prompted [Dont worry, as this will still be offline log generation]
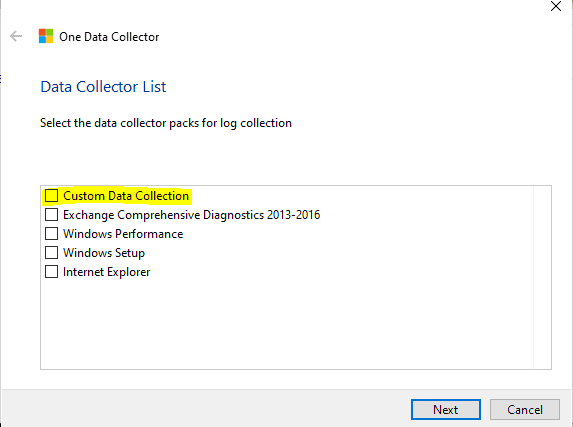
Choose Custom Data Collection from the Data Collector List and click Next
Browse and select the Intune.xml file that you saved in Step 1 and click Next
Allow the One Data Collector to complete and click Close when prompted.
- Navigate to
%localappdata%\elevateddiagnosticsto get the logs collected by the ODC tool.

Latest.cab will contain the results of the last run. If you unzip that, you get a file structure like the one below.
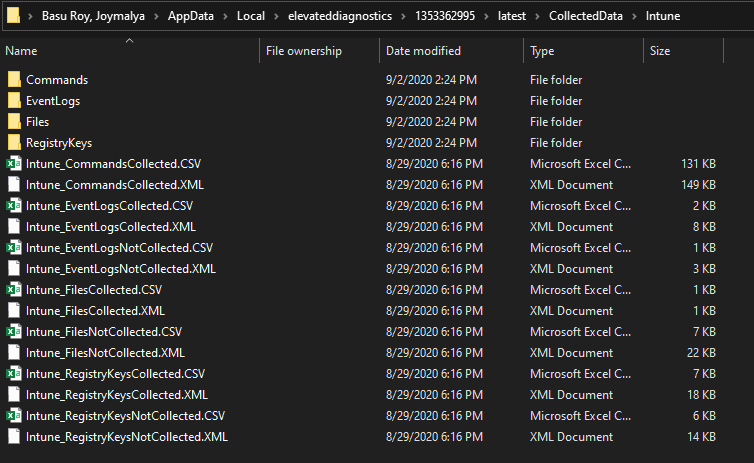
The folders which are of interest to me are
- EventLogs
- Files
Within Files, you get tThat’sated logs regarding all aspecThat’sIntune segregated and sorted into separate folders, as shown below, within which you will get the actual log files.
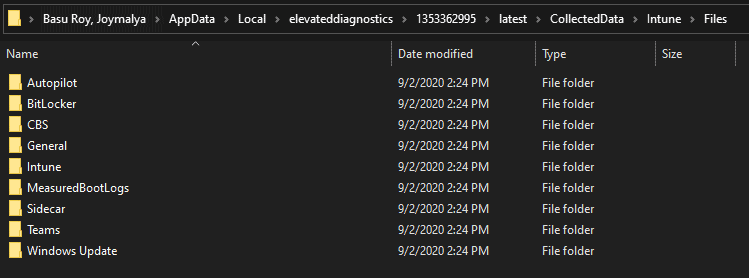
That’s all for today, to be contd.
That’s all we have for today. Go ahead and look through the logs yourself. Happy exploring!
In the following article of this series, I will be taking you through the relevant Windows registry entries for Intune, what Events log to check, and information that gets stored locally on the device, which can help you troubleshoot issues related to Intune.
Till then – keep reading, keep learning, and most importantly – Stay Safe
We are on WhatsApp. To get the latest step-by-step guides and news updates, Join our Channel. Click here –HTMD WhatsApp.
Author
Anoop C Nair is Microsoft MVP! He is a Device Management Admin with more than 20 years of experience (calculation done in 2021) in IT. He is a Blogger, Speaker, and Local User Group HTMD Community leader. His primary focus is Device Management technologies like SCCM 2012, Current Branch, and Intune. He writes about ConfigMgr, Windows 11, Windows 10, Azure AD, Microsoft Intune, Windows 365, AVD, etc.


