Let’s check how to Troubleshoot Windows Autopilot Issues with the MDM Diagnostics Tool. This post will discuss the benefits, usage, and examples of the Windows MDM Diagnostics Tool.
In my previous post, Windows Autopilot Troubleshooting Basics, we discussed different troubleshooting areas such as Network Activity, Registry, and Event Viewer.
MDM Diagnostics is a command-line tool for collating Windows Autopilot-related events. Most events, registries, and logs are consolidated into a single folder or file.
IT admins can use this tool to diagnose MDM-related problems from a single source.
[Related Posts – Windows Autopilot Step-by-Step Guides, Windows 10 Deployment Process Flow and Logs, Benefits Of Enabling Windows Autopilot Diagnostics Page HTMD Blog]
What are the Benefits of the MDM Diagnostics Tool?
The following are the benefits of the MDM Diagnostics Tool.
1. Automatically collect predefined logs and save them as zipping or Cab files.
2. Remote users can run the command and share the logs with IT to troubleshoot.
3. Use the Pre or Post-OOBE stage of Windows Autopilot.
Windows MDM Diagnostics Tool
The MDM Diagnostics Tool is a utility that diagnoses enrollment or device management issues in Windows devices managed by an MDM server. This tool helps IT Admins focus on one consolidated source for troubleshooting.
The MDM Diagnostics Tool provides a comprehensive view of relevant data and logs, simplifying the process of diagnosing MDM-related problems. It’s a valuable asset for IT professionals dealing with enrollment or Autopilot issues.
How to Use MDM Diagnostics Tool?
I recommend using the latest Windows 10 (1803 or later) version of the MDM Diagnostics tool. I have not tested the previous version of Windows 10 with this MDM diag tool.
Usage 1: Syntax: MdmDiagnosticsTool.exe -out < output folder path >
Example: MdmDiagnosticsTool.exe -out c:\temp
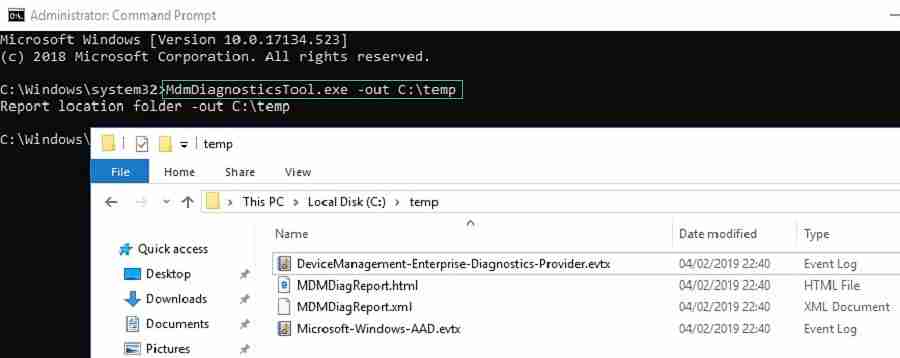
Usage 2: Syntax: MdmDiagnosticsTool.exe -area <area name(s)> -cab <output cab file path>
Execute the command line below to collect Windows autopilot-related events from the system for troubleshooting.
Example: MdmDiagnosticsTool.exe -area Autopilot -cab C:\LOGS.zip

3 (Three) Troubleshooting Areas of the MDM Diagnostics Tool
The Windows MDM Diagnostics tool can be used below 3 (three) troubleshooting areas to collect pre-defined areas and logs. But, in this post, we will focus only on Windows Autopilot.
- Autopilot
- DeviceProvisioning
- TPM
[Related Posts – Windows Autopilot Step-by-Step Guides, Windows 10 Deployment Process Flow and Logs]
The output of the MDM Diagnostics Tool
The diagnostics tool generates output in ZIP / CAB file format with the below files. We will go through each of the down output files and their purpose.
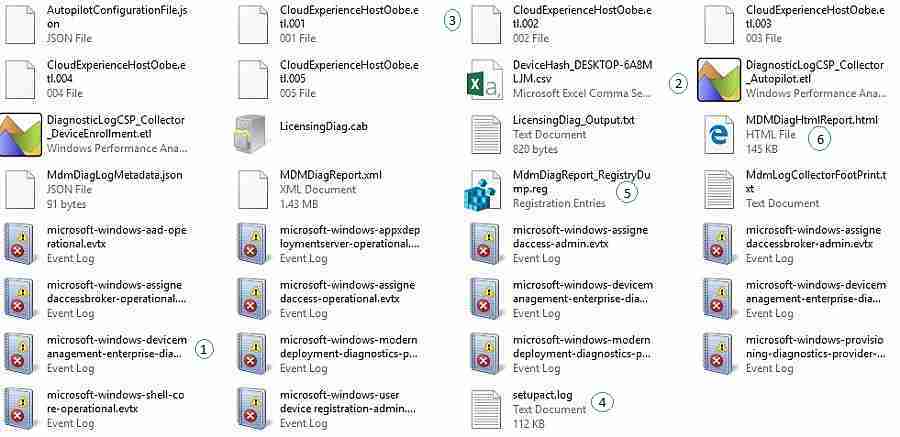
Deep Dive – Troubleshoot Windows Autopilot Issues with MDM Diagnostics Tool
This section provides more details about MDM Diagnostic tools. The following troubleshooting steps should help you in Windows Autopilot deployment scenarios.
Event Viewer
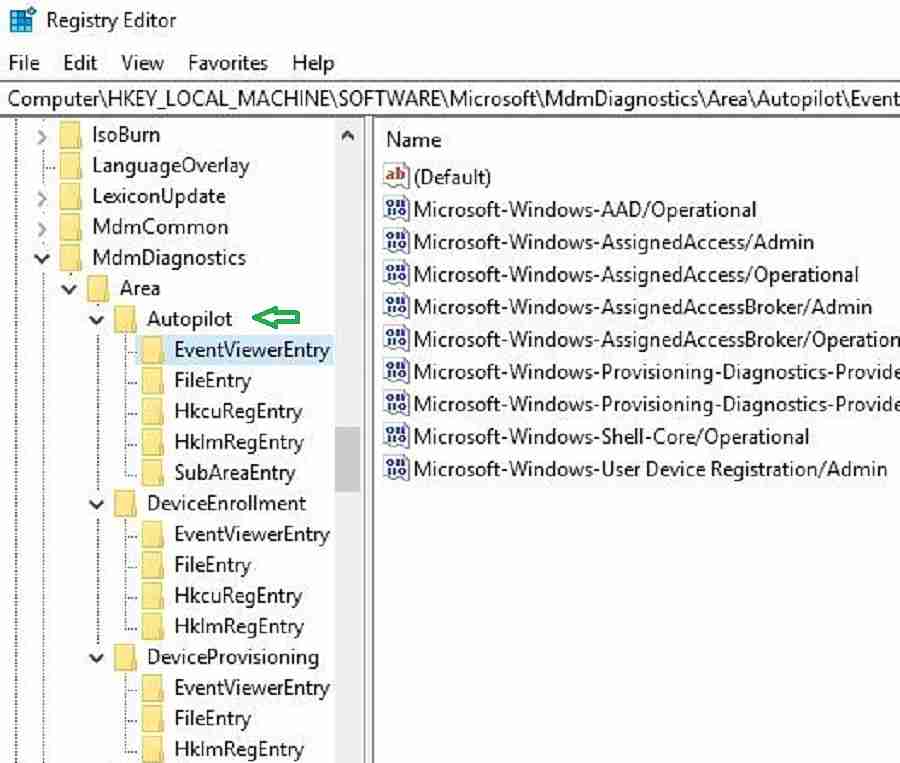
The MDM Diagnostics tool collects the list of event viewers below. Event viewers include client-side events like Autopilot events, policy actions, etc.
- Microsoft-windows-aad-operational
- devicemanagement-enterprise-diagnostics-provider
- microsoft-windows-assignedaccess-admin
- microsoft-windows-assignedaccess-operational
- microsoft-windows-moderndeployment-diagnostics-provider-autopilot
- microsoft-windows-provisioning-diagnostics-provider-admin
- microsoft-windows-shell-core-operational
- microsoft-windows-user device registration-admin
The below registry entries tell you a list of event viewer logs captured by the MDM Diagnostics tool.
Computer\HKEY_LOCAL_MACHINE\SOFTWARE\Microsoft\MdmDiagnostics\Area\Autopilot\EventViewerEntry
Diagnostic Logs – Autopilot and Device Provisioning
The below-listed ETL files are captured by the tool. What is ETL? It’s an Event tracing log created by Windows. This tool is used for in-depth analysis of the events.
The below ETL file will include system activity captured during the Autopilot and Intune device provisioning stage.
- DiagnosticLogCSP_Collector_Autopilot.etl
- DiagnosticLogCSP_Collector_DeviceProvisioning.etl
Computer\HKEY_LOCAL_MACHINE\SOFTWARE\Microsoft\MdmDiagnostics\Area\Autopilot\FileEntry

You must use the Windows performance analyzer tool to dive deep and analyze these ETL files.
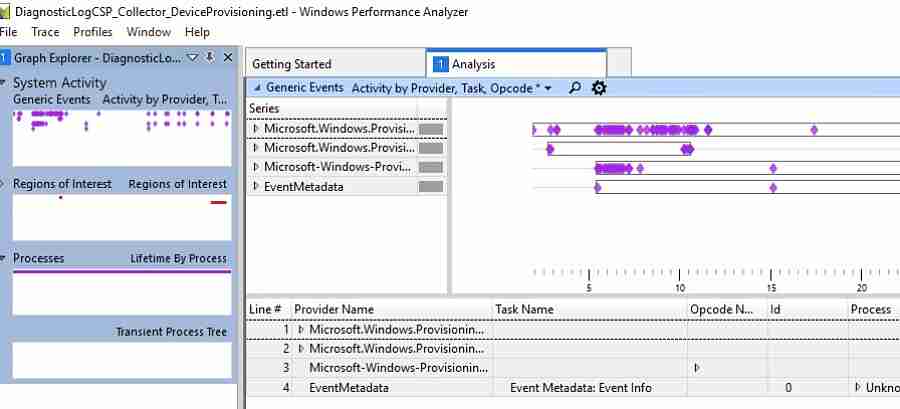
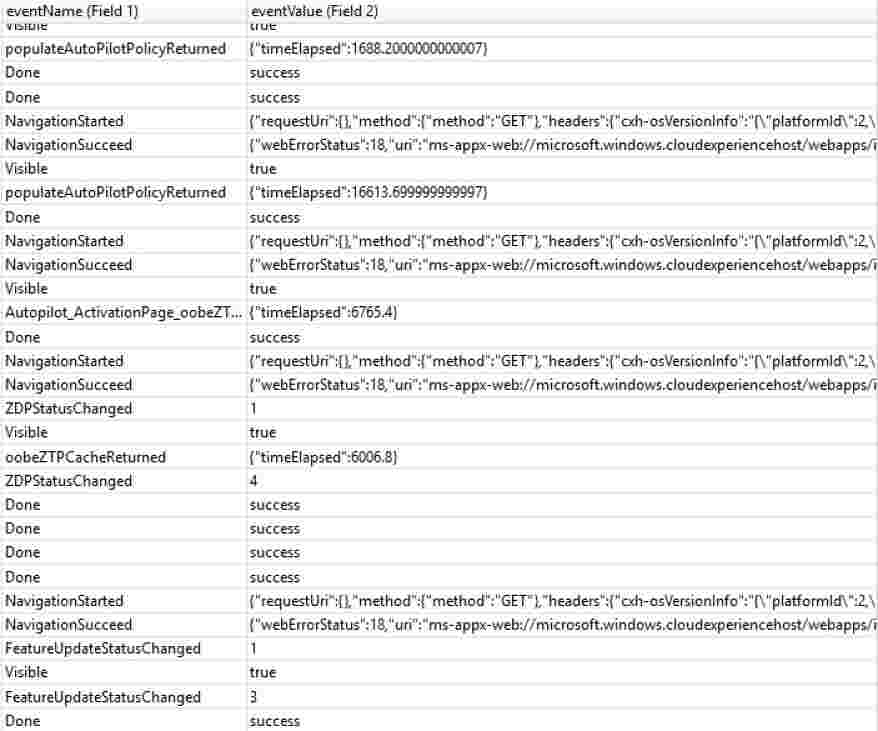
CloudExperienceHostOobe Windows Autopilot logs
Where is the location of CloudExperienceHost? It is part of the system apps within the c:\windows\systemapps folder.
In Windows Autopilot deployment, the CloudExperienceHost process communicates with Azure.
The MDM Diagnostics Tool generates Event Tracing Logs (ETW—Event Tracing for Windows) to trace CloudExperienceHost process activity. As shown below, you can analyze the log using a Windows performance analyzer.
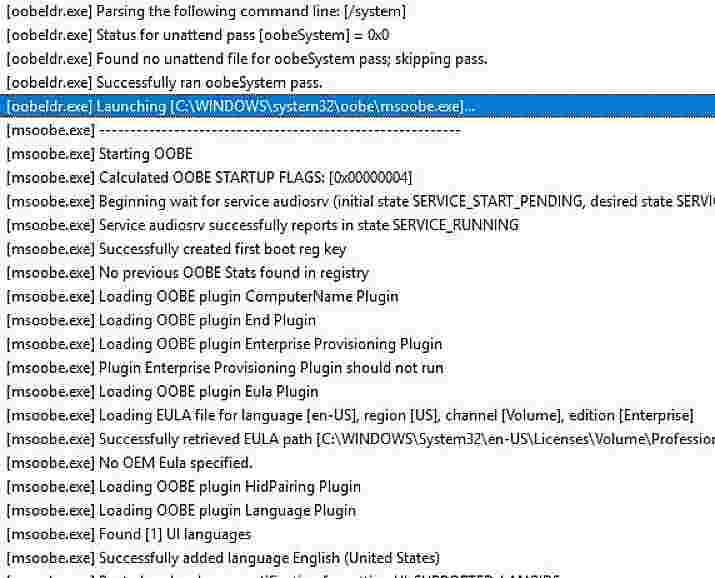
Setupact.log
This log file records actions or activity during the OOBE Phase of Autopilot.
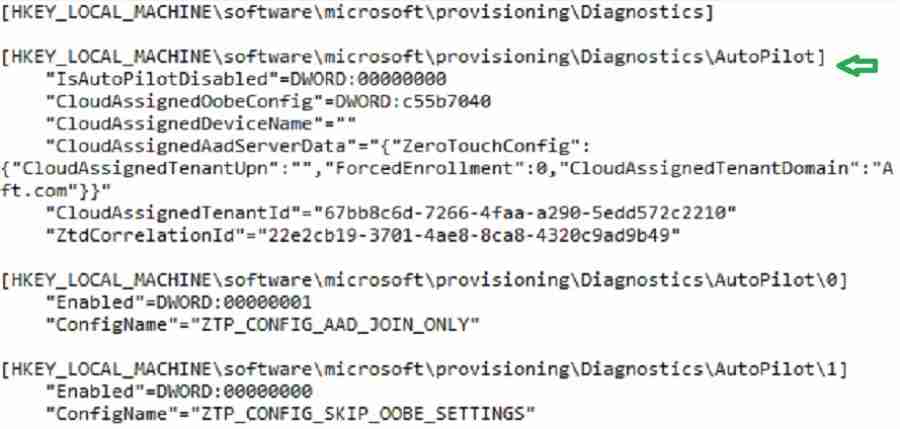
Registry Dump
MdmDiagReport_RegistryDump.reg captures the HKLM and HKCU registry values associated with autopilot device provisioning.
Autopilot-related values are written to HKLM\SOFTWARE\Microsoft\Provisioning\Diagnostics\AutoPilot
Intune CSP-based configurations are written to HKEY_LOCAL_MACHINE\software\microsoft\policymanager\
MDMDiag Report
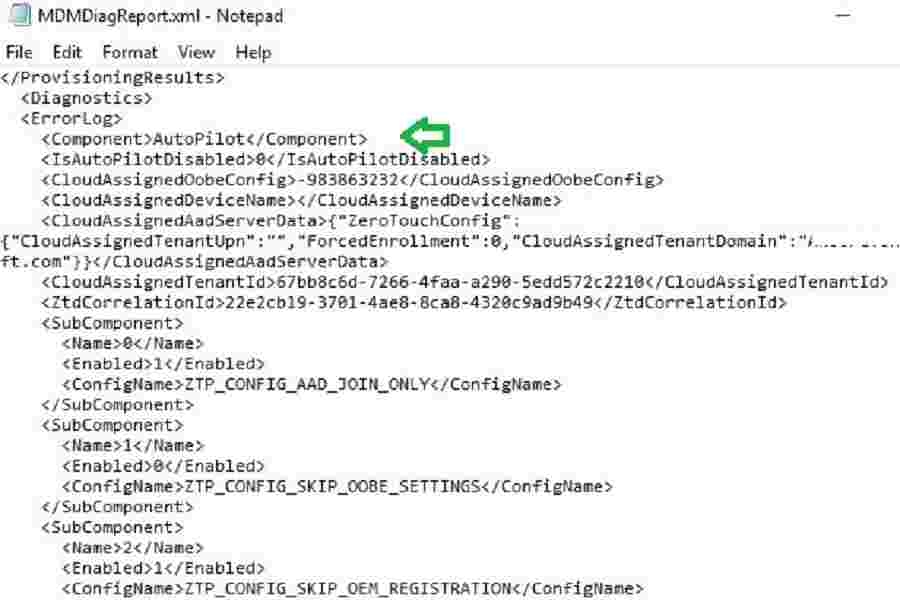
The MDMDiagReport.xml report provides the resultant Autopilot settings applied by Intune.
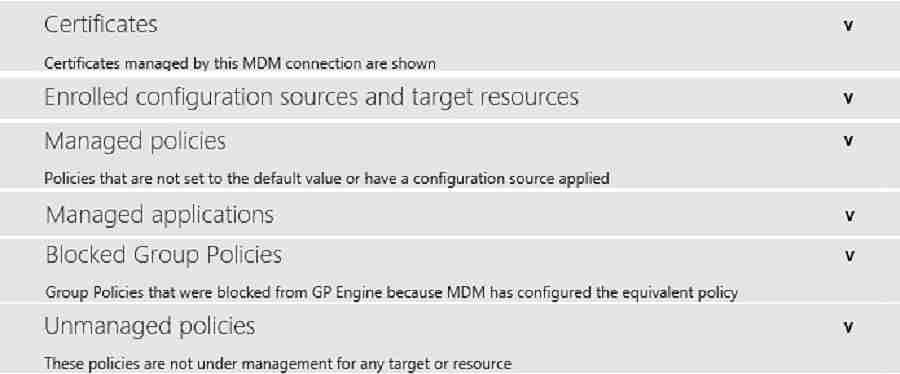
MDMDiagHtmlReport.html report provides complete details on the applied Intune Policy CSP Settings, certificates, applications, etc., on the autopilot device.
Resources
- Windows Autopilot Deployment Scenarios – On-Prem Hybrid Domain Join
- Step-by-Step Guide Windows AutoPilot Process with Intune
- Beginners Guide Setup Windows AutoPilot Deployment
- Windows Autopilot Video Starter Kit
We are on WhatsApp. To get the latest step-by-step guides and news updates, Join our Channel. Click here –HTMD WhatsApp.
Author
Vimal Das has over ten years of experience in SCCM device management solutions. His primary focus is Device Management technologies like Microsoft Intune, ConfigMgr (SCCM), OS Deployment, and Patch Management. He writes about technologies like SCCM, Windows 10, Microsoft Intune, and MDT.


>Example: MdmDiagnosticsTool.exe -area Autopilot -cab C:\LOGS.zip
This should be
Example: MdmDiagnosticsTool.exe -area Autopilot -cab C:\LOGS.cab
You meant it should be *.CAB instead of *.ZIP !
HResult:0x800700a1 error while capturing cab logs
This because the path you chose is not accessible. Create a folder and point to that folder or use a folder you have access to.
how do i turn it off , it keeps crashing my game right in the middle , its it everytime an its only when i play one game