Let’s learn how to collect Network trace for troubleshooting in Microsoft Edge. Browser trace is a meaningful way of capturing additional information to ask Microsoft Support when troubleshooting an issue.
Microsoft Edge is a proprietary cross-platform that provides several features for users. It is a supported browser for troubleshooting issues and a systematic approach to solving problems.
Many browsers support tools for capturing browser traces. This blog post explains using a Microsoft Edge browser trace for troubleshooting in the Azure portal. You can use the same methodology to check any other sites, and collect the details. Microsoft support uses these traces for troubleshooting purposes only.
Edge browser trace information helps users access essential details about what is happening in the portal when an issue occurs. Step recording and console output are the other factors that help obtain details about what is happening in the Azure Portal.
- Enable Disable Smart Actions in Microsoft Edge
- New Text Prediction and Other Features in MS Edge Browser
Microsoft Edge Network Trace for Troubleshooting
Edge browser tracing for troubleshooting can be done on the site you browse. If you are exploring, for example, Intune or Azure Portal, Signing in before starting the trace is essential, which doesn’t contain sensitive information about your account. After that, you can start recording your steps in the portal using the Step Recorder.
| Different Steps of Edge Browser Trace for Troubleshooting |
|---|
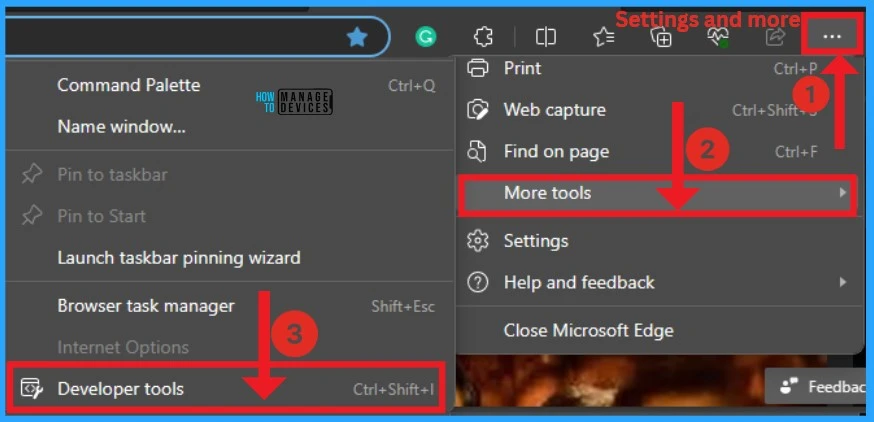
| Press Ctrl+Shift+I to launch Microsoft Edge Dev tools. Dev Tool can also be found from the toolbar menu under More tool > Developer tools |
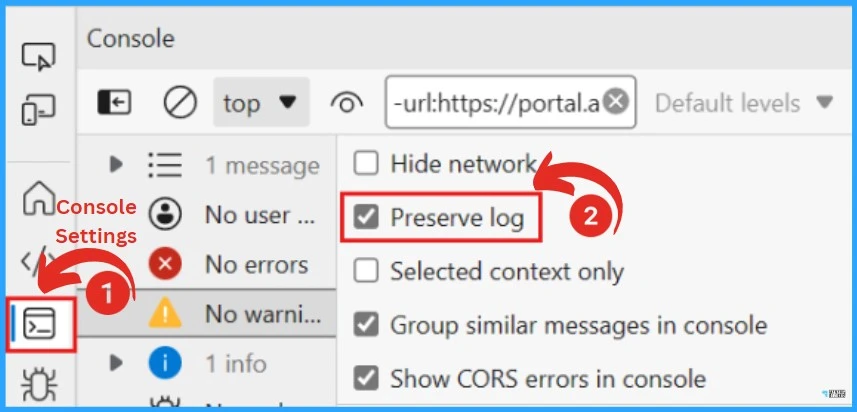
After that, Select the Console tab, select Console settings, and then select Preserve Log. The browser only keeps trace information of the current loaded page by default. Select the Console tab, select Console settings, and then choose Log Preserve
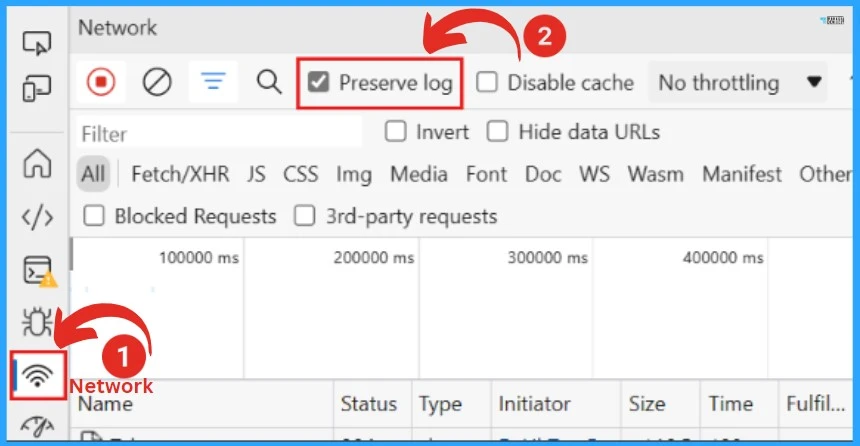
After that, select the Network tab on the left side of the window. If the Network tab isn’t visible, click the More tools (+) button and select Network. Then click on the Preserve log option from the Network tab.
You can quickly stop recording the Network tab. Click the Stop recording option and clear. Check the screenshot below.

After that, select the Record network log and reproduce the issue in the portal. The screenshot below will guide you.

The screenshot below shows the session output. It shows the name, status, type, initiator, size, time, fulfilment, and waterfall. You will get a similar session output.
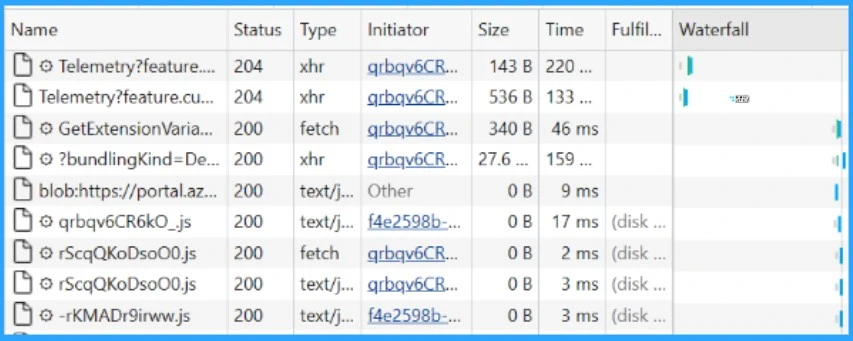
Select the Stop recording network log after you have reproduced unexpected portal behaviour. Then select Export HAR and save the file.

After that, stop the Steps Recorder and save the recording. Then, select the Console tab in the Edge browser developer tools pane. Right-click one of the messages, select Save and keep the console output to a text file.
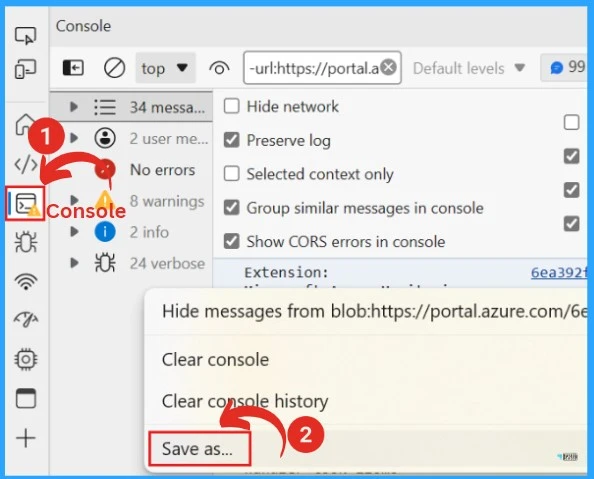
Note:– You can pack the browser trace HAR file, Console output and screen recording file in a compressed format such as .zip and share it with Microsoft Support
Reference
Capture a browser trace for troubleshooting
We are on WhatsApp. To get the latest step-by-step guides and news updates, Join our Channel. Click here for HTMD WhatsApp.
Author
Gopika S Nair is a computer enthusiast. She loves writing on Windows 11 and related technologies. She is here to share quick tips and tricks with Windows 11 or Windows 10 users. She is Post Graduate Diploma Holder in Computer Science.


