Let’s learn how to Integrate Power BI with Intune and create reports using Power BI. The present discourse details the procedure for creating an Intune report from the OData feed using Power BI. The report created through this process is expected to provide significant insights into relevant data and be valuable for business or academic purposes.
Have you used Power BI to generate reports before? This application can be installed on your desktop, and you can explore the tool by creating simple reports. Creating and sending many reports daily to higher management as an Intune administrator is important. You may be using the Intune default reporting option available in the portal, but have you considered improving your reporting by integrating Intune reports with Power BI?
Integrating Power BI with Intune can significantly improve the way you analyze and visualize data. By combining the power of these two tools, you can create informative reports that help you make better decisions. The process of integrating Power BI with Intune can prove to be a valuable asset in enhancing data analysis
It’s important to note that Power BI is no longer supported on Windows 7, so if you’re using that operating system, you may want to consider upgrading to a more recent version. This article will guide you on Integrating Power BI with Intune and creating reports using Power BI. Let’s get started..!!
- How to Integrate PowerBI with SCCM Video Recording by Mohan ConfigMgr
- How to Build PowerBI Live Dashboard Integration with SCCM | ConfigMgr
Advantages of using Power BI to Create Reports
The PowerBI has many advantages that would attract you to use it daily to create many reports. One of its primary advantages is its ability to manage large volumes of data while maintaining performance and scalability. Also, we have seamless integration with other Microsoft products, making it an ideal choice for organizations seeking to enhance their reporting capabilities. You already would have integrated the PowerBI with SCCM to create SCCM reports.

Power BI is indeed a great solution for managing and analyzing data. Its feature-rich platform, ease of use, and versatility make it a highly recommended tool for businesses and academic institutions. Using Power BI, organizations can effectively manage and analyze their data in a cost-effective and efficient way, which is crucial for staying competitive in today’s data-driven world.
There are many advantages to creating reports using Power BI. Let us discuss the main advantages below.
- It creates a deeper insight
- Artificial Intelligence
- Help to analyze data
- It allows Excel integration
- It can be shared with Business professionals
- It connects to different sources of data
- The data is to be visualized in many ways
- It allows customizable dashboards
- It is a free application
- It gives effective reports based on data
Install Microsoft Power BI Desktop
Microsoft Power BI Desktop must be installed on your workstation before you start integrating Intune with PowerBI. Installation of the PowerBI is one of the prerequisites to consider. PowerBI is a free application that you can download from the Microsoft Download Center. You can also use Microsoft Power BI Online to Create reports
We have previously provided detailed instructions on the best way to install Microsoft Power BI Desktop. If you are unfamiliar with PowerBI reporting, I suggest you look at the article. It is a good starting point for PowerBI, and having a basic understanding of PowerBI reporting is another prerequisite before you start integrating Intune with PowerBI.
What’s OData Feed (Open Data Protocol)
You should have enough permission to Reports in Intune to create the reports. We will connect to your tenant’s OData (Open Data Protocol) feed for the Intune Data Warehouse.
NOTE! OData (Open Data Protocol) is an ISO/IEC approved, OASIS standard that defines a set of best practices for building and consuming REST APIs. It enables creation of REST-based services which allow resources identified using Uniform Resource Locators (URLs) and defined in a data model, to be published and edited by Web clients using simple HTTP messages. You may be confused by the use of the terms entity and table when you work on Power BI and OData. In the OData universe, the containers called tables in Power BI are called entities. These terms both refer to the same thing that holds your data
| Containers | Discription |
|---|---|
| Table | A table consists of data fields that can only hold data of a specific data type, such as numbers, text, dates, etc. |
| Entity | An entity consists of data fields that can only hold data of a specific data type, such as numbers, text, dates, etc. |
Integrate Power BI with Intune
Let’s learn how to Integrate Power BI with Microsoft Intune.
- Sign in to the Microsoft Intune admin center.
- Select Reports > Intune Data warehouse > Data warehouse.
Use Intune’s data warehouse to generate reports that provide insights into your enterprise environment. With the Intune data warehouse, you can access:
- Historical Intune data
- Data refreshed on a daily cadence
- A data model using the OData standard
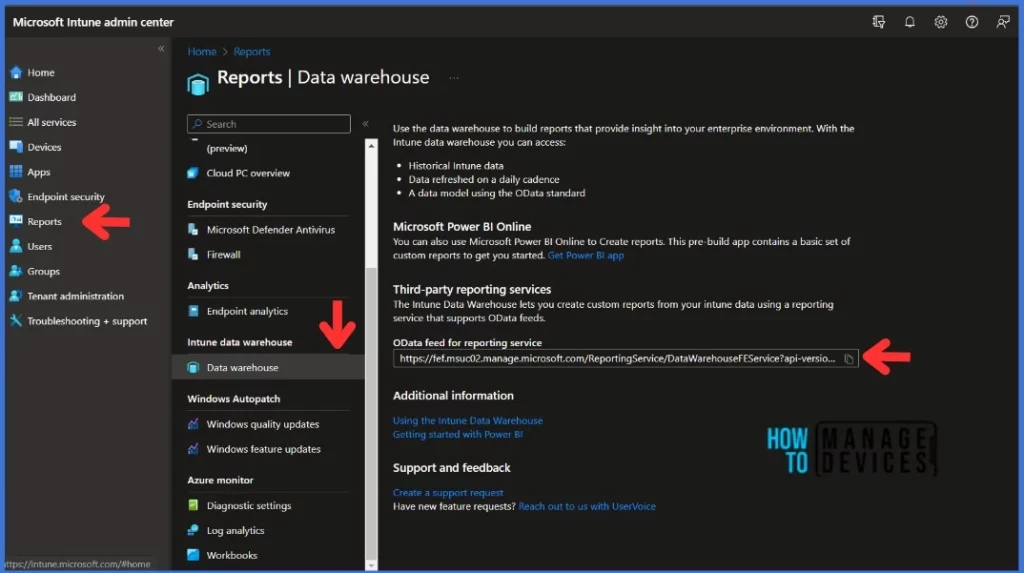
- Copy the custom feed URL, in this example, below is the custom feed URL.
https://fef.msuc02.manage.microsoft.com/ReportingService/DataWarehouseFEService?api-version=v1.0
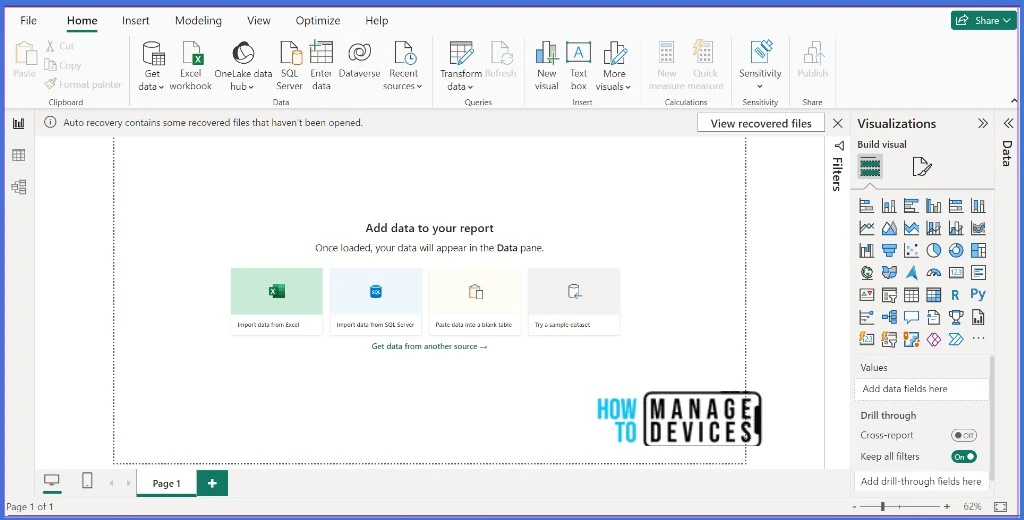
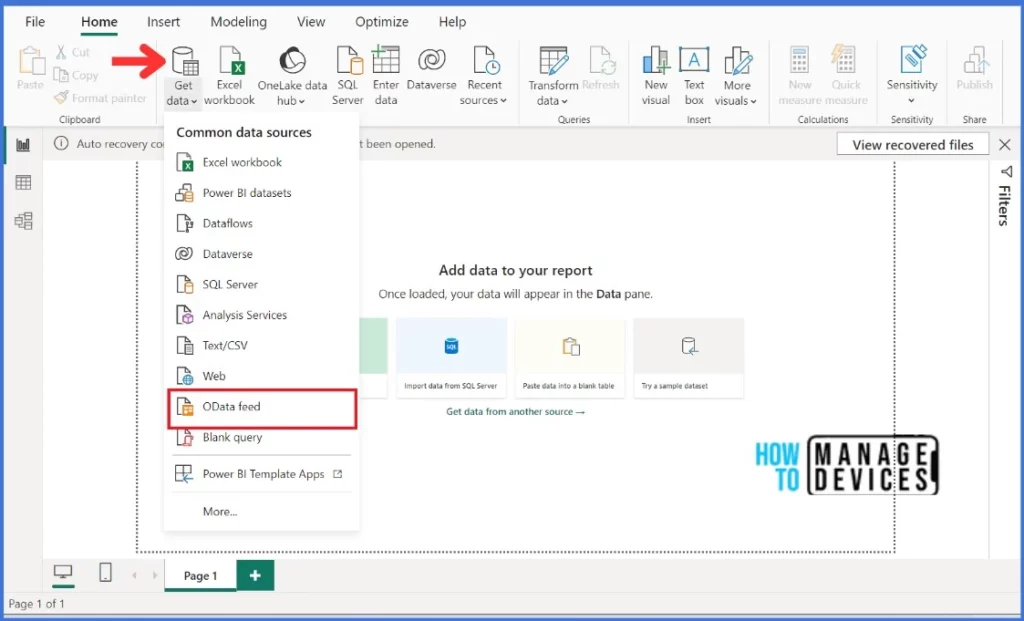
- Open the Power BI Desktop application. You can also use Microsoft Power BI Online as well
- Select Home> Get Data > Odata feed from the menubar
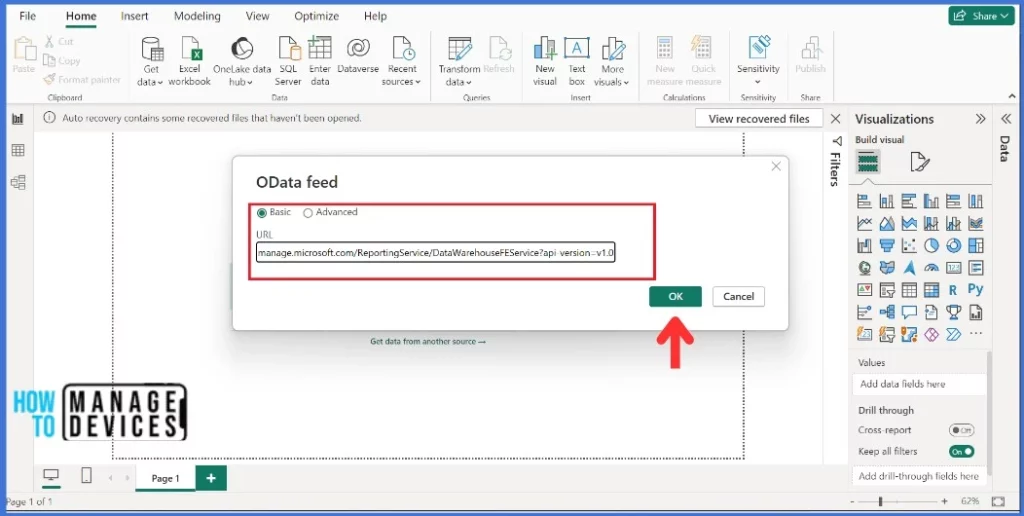
You will get a new pop-up to paste the custom feed URL that you copied from the earlier step. Make sure to select Basic and paste the custom feed URL. Click OK to continue.
- Select Organization account, and then sign in with your Intune credentials and select Connect to continue. Please remember you should have enough permission to create Reports in Intune.
Once you click on Connect, a new Navigator will open and show you the list of tables in the Intune Data Warehouse.
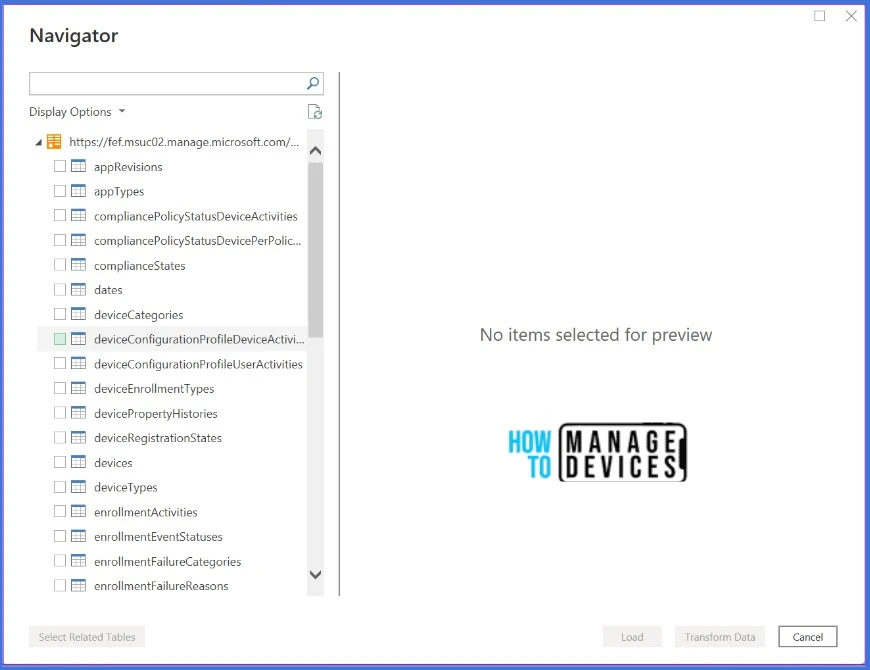
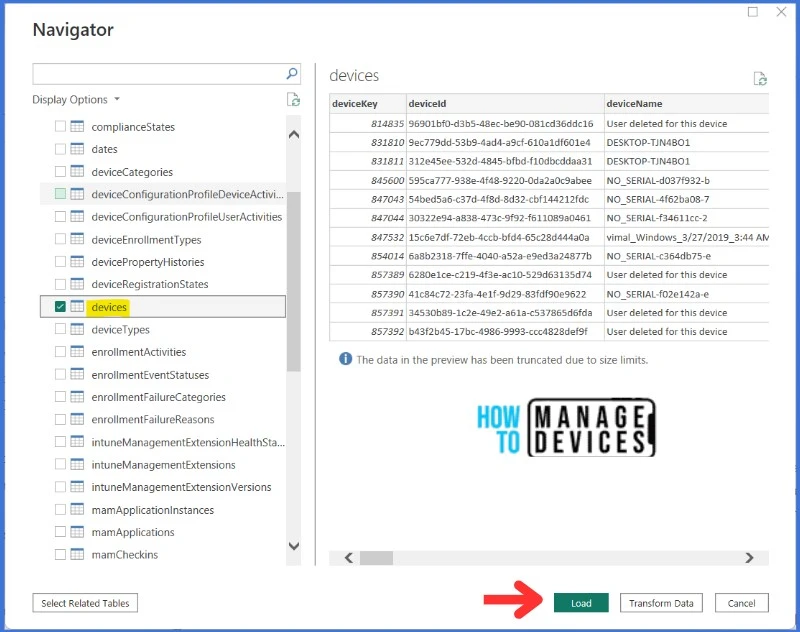
You have the option to choose which table you would like to explore at this time. Simply click on any table to view a preview and see the available data without having to load the full report. In my case, I will select the Devices table and click on Load to proceed. Keep in mind that PowerBI allows you to select multiple tables at once.
Create a Table Visualization Report in PowerBI
You now have the table and data, so let’s create a simple report using the data from Intune Data Warehouse.
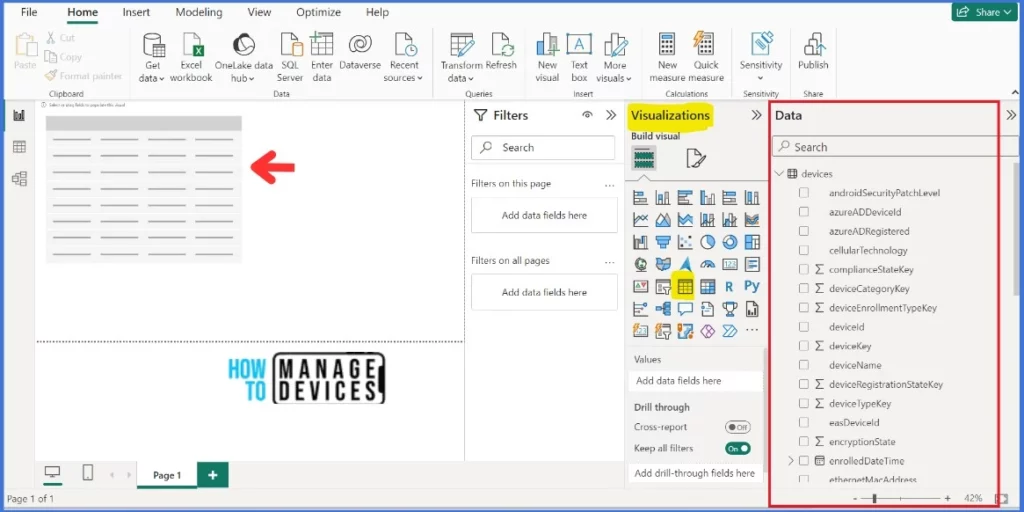
Expand the Data options that are available on the right side of the Power BI page. Data options depend on the data that you entered in the Power BI. You should now be able to see the tables and columns that you have loaded.
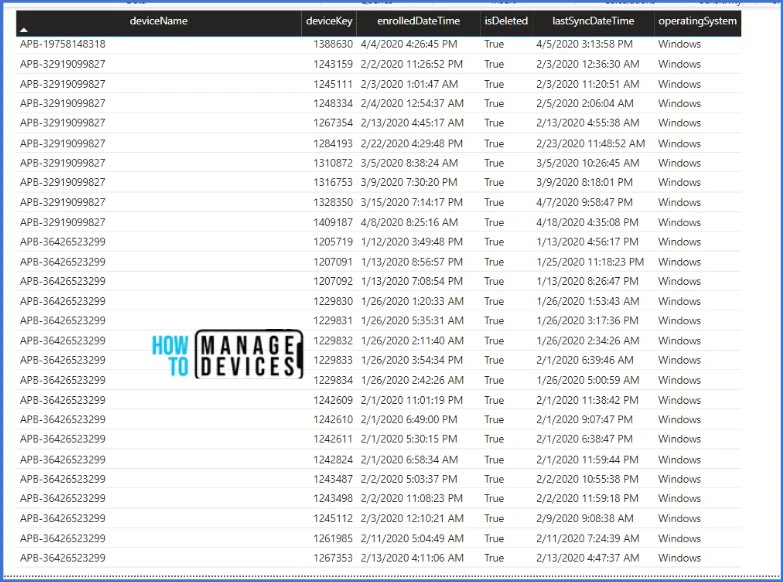
The Visualization feature in the Power BI desktop constitutes a central component of the platform, enabling users to select their data report’s design. Users can effortlessly insert any column by dragging them from the Data panel to create a table within Visualization. The intuitive design of the Visualization function allows users to seamlessly customize their data reports, providing the opportunity better to understand key insights and patterns within their data.
In this example, I have selected deviceName, deviceKey, entrolledDateTime, isDeleted,operatingSystem and lastSyncDateTime and created a simple report.
Filters are used to show any particular data by using the filter option. For example, If you want to see the deleted devices, you can use this filter option; it will be shown on the page. There is an option to add a data field to the filter.
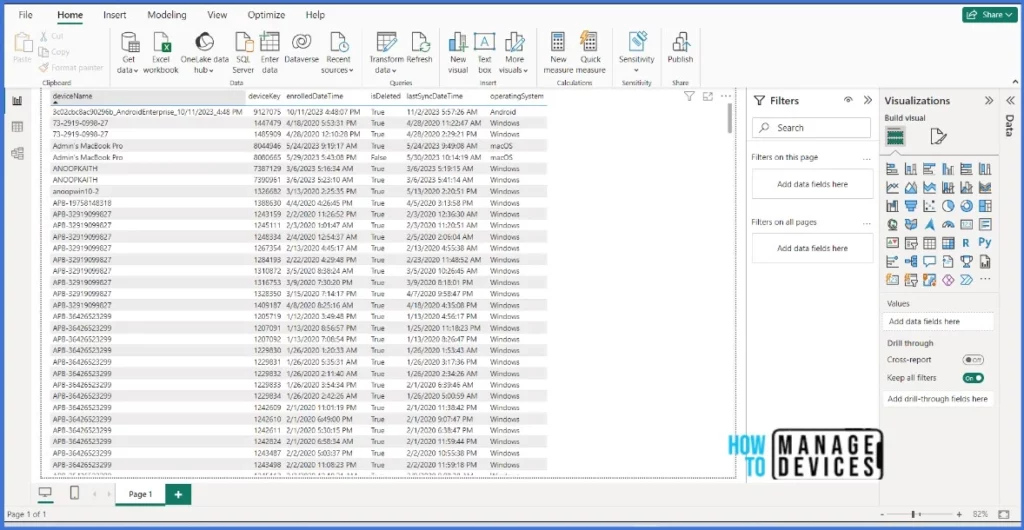
The Visualization feature can be leveraged to optimize the efficacy of your report. I have integrated certain features via the format visual option to augment the report’s visual appeal. I would recommend you explore more and create more efficient reports.
There are many visualization options available. For example, treemap, pie chart, Line Chart, Card, Matrix etc. Take the time to explore PowerBI and expand your knowledge. By doing so, you will be better equipped to produce professional and visually appealing reports. Consistent practice will help you to improve and refine your skills.
Thank you for your patience in reading this post. See you in the next post. Keep supporting the HTMD Community.
We are on WhatsApp. To get the latest step-by-step guides and news updates, Join our Channel. Click here – HTMD WhatsApp.
Author
About Author – Sujin Nelladath has over 10 years of experience in device management technologies and Automation solutions. He writes and shares his experiences related to Microsoft device management technologies, Azure, and PowerShell automation.

How do i refresh intune data in powerBI?
The refresh option in Power BI depends on the type of data source and the storage mode of your semantic model. There are different ways to refresh your data, such as manual refresh, scheduled refresh, automatic page refresh, and change detection. You can find the refresh option in the Power BI service or in Power BI Desktop, depending on your scenario. In this example, You can see the refresh option on the queries box in the ribbon.
we can’t use any more OData feed for Intune data warehouse since getting below error. Appreciate how to overcome this issue
DataSource.Error: OData: Request failed: The remote server returned an error: (500) Internal Server Error. (Internal Server Error)
Details:
DataSourceKind=OData
DataSourcePath=https://fef.xxx.manage.microsoft.com/ReportingService/DataWarehouseFEService/deviceCategories
Url=https://fef.xxx.manage.microsoft.com/ReportingService/DataWarehouseFEService/deviceCategories?api-version=v1.0
As per microsoft, there is no centralized or report-central solution to increment the default value for timeout of 10 minutes to a higher value. In the Advanced Editor of Power BI the timeout value can be altered per OData query by appending , Timeout=#duration(days,hours,minutes,seconds) to the OData.Feed statement.
For example, to increment the timeout to 2 hours, the following query:
Bron = OData.Feed(“https://bridge-online.cloud/3279/odata4/”, null, [Implementation=”2.0″]),
has to be changed into
Bron = OData.Feed(“https://bridge-online.cloud/3279/odata4/”, null, [Implementation=”2.0″, Timeout=#duration(0,4,0,0)]),
what permissions do i need to provide to user id to integrate the power bi with intune to create the report dashboard.
The user must be one of the following:
Microsoft Entra Global Administrator
Intune service administrator
User with role-based access to the Intune data warehouse resource