Let’s learn how to install and use Microsoft Power BI Desktop. Power BI is a Business intelligence and Data visualization tool. It updates and releases monthly and always supports the latest version of Power BI for your System. Power BI is a free application.
Users can import, create, and analyze data through many sources. Power BI has the best and easy user interface that makes it different, so any non-technical user can make a report and create custom dashboards. Power BI is an important application that users can install on a PC and create live reports basis on Data.
Power BI is connected to the world’s data and can connect data from different Sources. With the help of Power BI, you can build advanced models and reports. Power BI is easily used in Windows, but now it’s no longer supported on Windows 7.
Here, you will get a complete guide on installing and using it and sharing the experience of using Power BI. For many of the people who did not consider them report creators and not consider them as analytics, Power BI is the best solution for those people.
- How to Install and Use Microsoft Power Automate Desktop
- Change Default Print Screen Key Behaviour in Windows
What are the Advantages of Power BI?
Power BI is one of the most important applications of Microsoft. This application allows users to connect data from different sources and create models to meet their needs. Power BI plays an important role in Business nowadays. The main advantages of Power BI Desktop are given below.
1. It creates a deeper insight
2. Artificial Intelligence
3. Help to analyze a data
4. It allows Excel integration
5. It can be shared with Business professionals
6. It connects to different sources of data
7. The data is to be visualized in many ways
8. It allows customizable dashboards
9. It is a free application
10. It gives effective reports based on data
How to Install Microsoft Power BI Desktop
Power BI is a free application, and this application is used in business intelligence for creating reports based on data. With the help of Power BI, you can create a report and publish it to the Power BI Desktop application. It is available in the pro version, and the free licensed version has some limitations.
The Power BI helps you to access anytime, anywhere to empower insights. You can install this application directly from your Microsoft Store or download it from the Microsoft Download Center. In the Microsoft Store, you can able to see many different options. The Power BI Desktops give you the full functionality to model.
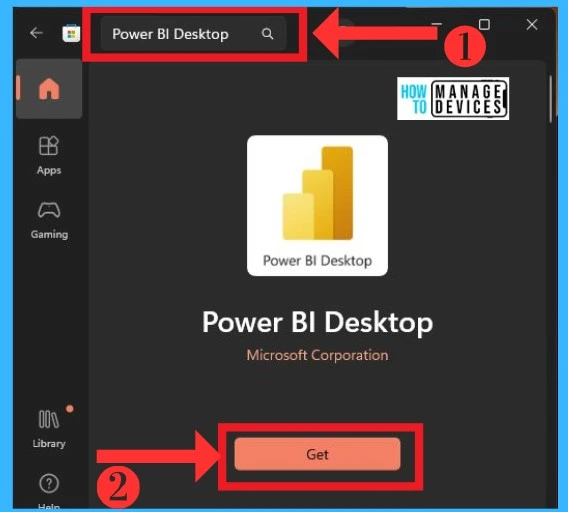
- Search Power BI Desktop in the search box of the Microsoft store
- Click on the Get option from the below window
Download and Install from Web
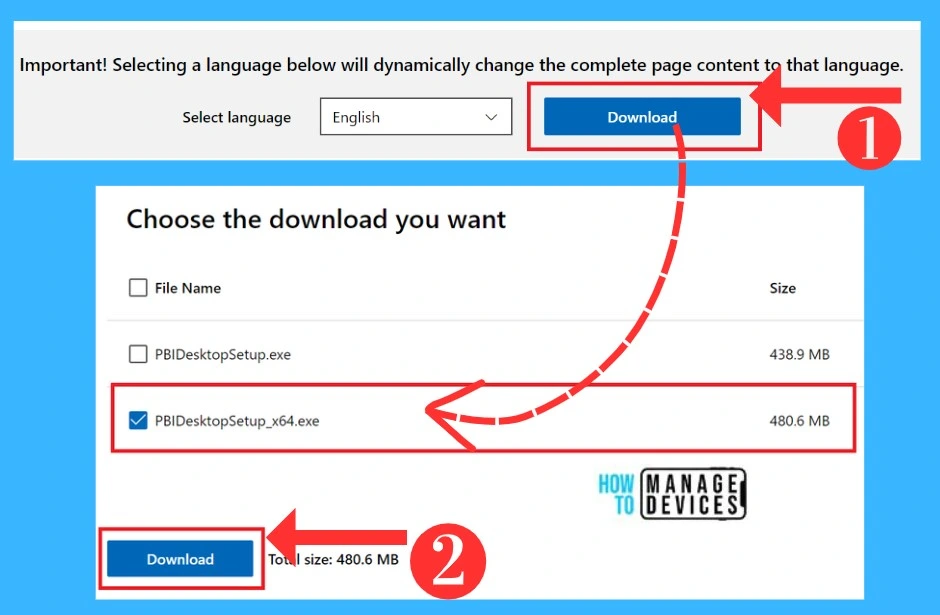
The Power BI is easily downloaded from the Microsoft Download Center. In the website download, there are some procedures in downloading sessions. The below screenshot shows how to download Power BI from the Web.
- Click on the Download option from the Microsoft Download Center
- Specify the 32-bit or 64-bit installation file to download.
Get Started
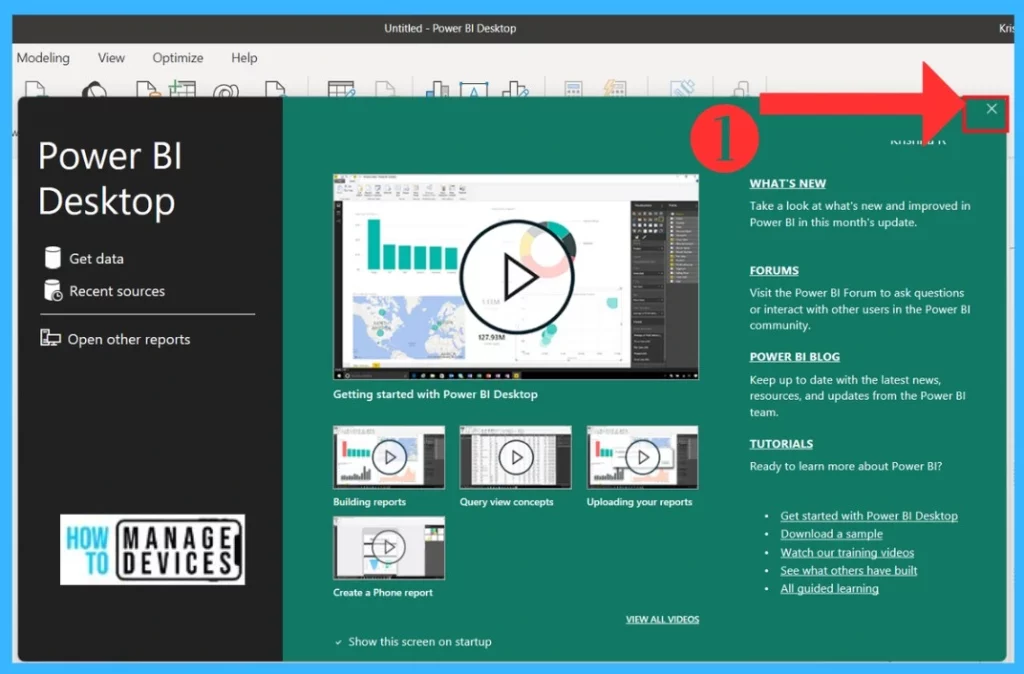
After installing, you will get a Get Started welcome window to the screen; there are 2 options Get data, Recent sources, and open other Reports. If you don’t need them, you can easily close them with a close icon to open the home screen of the Power BI. The below list and screenshot show the welcome screen option.
- Get Data – Connect to the data from multiple sources
- Recent Sources – Shows the recent data added to Power BI
- Open other reports – It opens a new file location
Home Screen of Power BI Desktop
The Home Screen of Power BI consists of many options, with this option to analyze data through many sources. You can work with the Home Screen. First, introduce you to the home screen interface options available in the Power BI. The below screenshot shows the Power BI home Screen.
Note: You can add pages to the existing Power BI page by using the + Plus symbol next to the Page 1 option
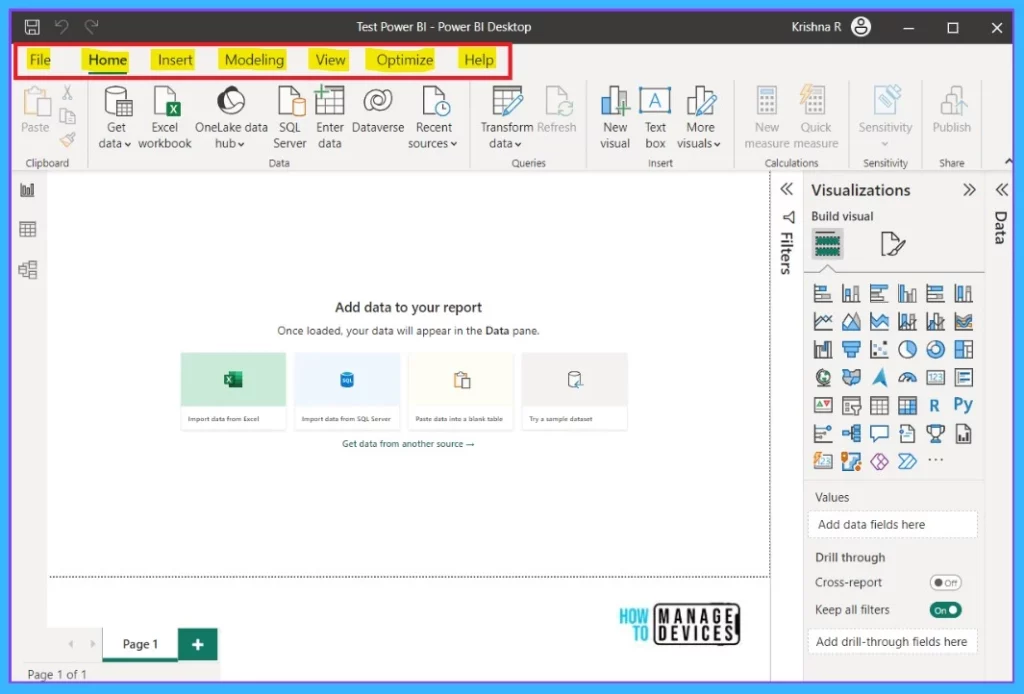
In the above Screenshot, you can able to see the home screen. In-home screen first introduces all the menus like the File menu, Home menu, etc. This tab contains many options in each menu, and the menu is given below the list.
- File
- Home
- Insert
- Modelling
- View
- Optimize
- Help
1. File Menu
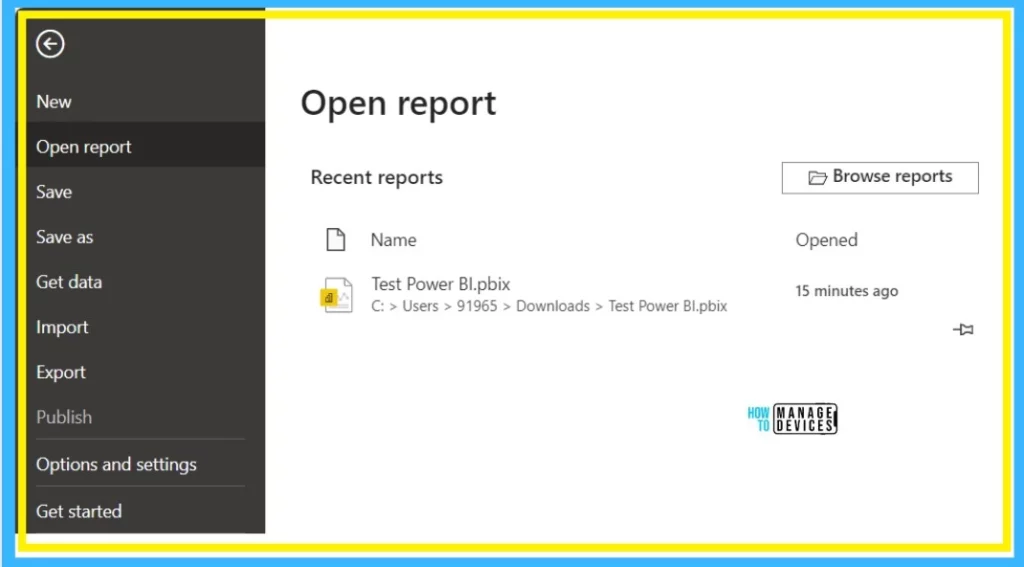
The File menu is the first option, which includes many options for adding a new page, saving options setting options, etc. With this tab option, you can Import and Export data and get data from here. The below screenshot shows the Power BI File menu.
2. Home Menu
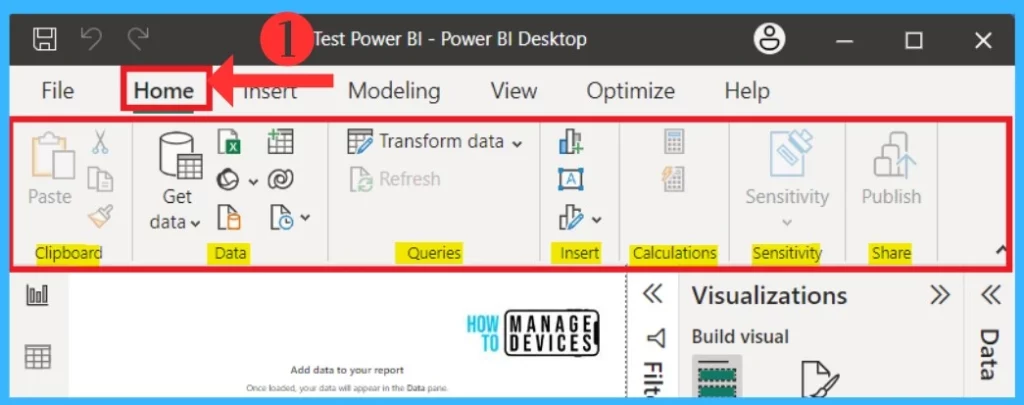
The Home Menu is the important menu with options for connecting data sources. In-Home Menu, you can get data from there. All Menus contain specific groups, and the Home menu contains some groups like Clipboard, data, queries, insert calculation, sensitivity and Share.
This specific group contains multiple Ribbons. The below table and screenshot show the Home Menu and the Ribbons.
- Select Home Menu from the Home screen of Power BI Desktop
| Ribbon Menus | Use to |
|---|---|
| Get data | Connect to data from multiple sources |
| Excel workbook | Import data from a Microsoft Excel workbook |
| OneLake data hub | It discovers data from your org |
| SQL Server | Import data from a SQL Server database |
| Enter data | Create a new table by typing or pasting in new content |
| Dataverse | Connect to Dataverse through its SQL endpoint |
| Recent sources | Manage and connect to recent sources |
| Transform data | Use the Power Query editor to connect, prepare, and transform data |
| New visual | Add a visual to your report |
| Text box | Add a text box to your report |
3. Insert Menu
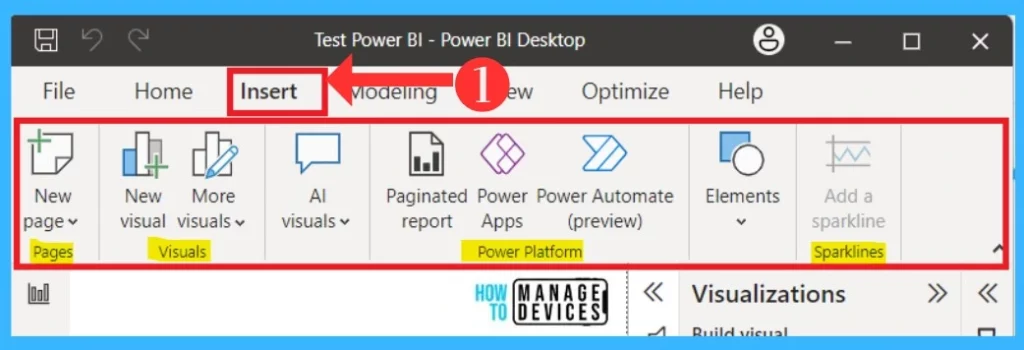
Insert Menu is another Menu option. In this option, you can insert many features into the report of your data. You can easily select Insert Menu from the Power BI Desktop home screen. The insert menu contains 4 groups: Pages, Visuals, Power platform, and Sparklines. Those groups contain multiple ribbons. The below list and screenshot show the Insert menu in Power Bi Desktop.
- New Pages – Add a page to your report
- New visual – Add a visual to your report
- More visuals – Add Power BI visuals from AppSource or your files
- Key influencers – Add key influencers visual to your report
- Decomposition tree – Add a decomposition tree visual to your report
- Smart narrative – Add an auto-generated written summary of your data to this report
- Paginated report – Embed a Paginated Report visual in your report. Both reports will update in real-time as changes (like cross-highlighting or filter selections)are made
- Power Apps – Embed a Power App into your report so people can use the app without leaving Power BI
- Power Automate(preview) – Create a Power Automate button to trigger automated tasks without leaving Power BI
- Text box – Add a text box to your report
- Buttons – Add a button to your report
- Shapes – Add a shape to your report
- Image – Add an image to your report
4. Modeling
In Modeling, it gives you the report modelling features for your data report. Modelling includes data relationships, calculations, page Refresh, Parameters, Security and Q&A groups. These menu groups provide multiple ribbons for modelling a data report with different features. The below screenshot and table show the Modeling Menu.
- Select Modeling from the Home screen of Power BI Desktop
| Ribbon Menus | Use to |
|---|---|
| New Table | Write a DAX expression to create a new table |
| New Parameters | Add parameters to visuals and DAX expressions to act as variables. Report readers can use slicers to adjust the inputs and see different outcomes |
| Language | Change the language used to ask questions in Q&A |
| Linguistic Schema | Import or export a file containing important information Q&A uses to understand your dataset and the custom terms you’ve taught Q&A to understand |

5. View Menu
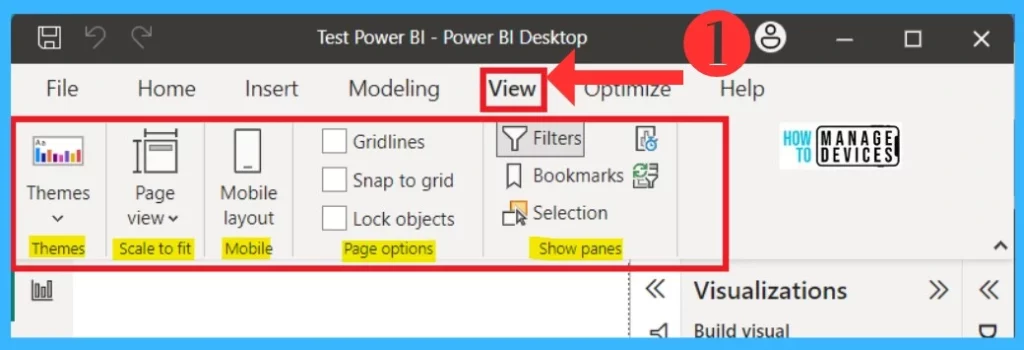
In the View Menu, you can set the theme, report page view size, etc. And you can also use this menu to set the design on a report for mobile devices. The view menu can easily access from the home screen of Power BI Desktop. The view menu contains 5 groups Theme, Scale to fit, Mobile, Page options, and Show panes.
- Page view – Choose a page view. We’ll save this setting with your report
- Mobile layout – Design your report for mobile devices
- Gridlines – Show gridlines to help you manually align objects in your report
- Snap to grid – Automatically align objects in your report
- Lock objects – Lock all objects in place so they stay put while you’re giving a presentation or interacting with report elements
- Filters – Show or hide the filter pane while editing. This doesn’t affect its visibility for report readers
- Bookmarks – View or apply created bookmarks
- Selection – Manage the visibility and layering order of objects in your report
- Performance – analyzer Assess your report’s performance and identify areas for improvement
- Sync – slicers Synchronize slicers and control their visibility across pages in your report
6. Optimize
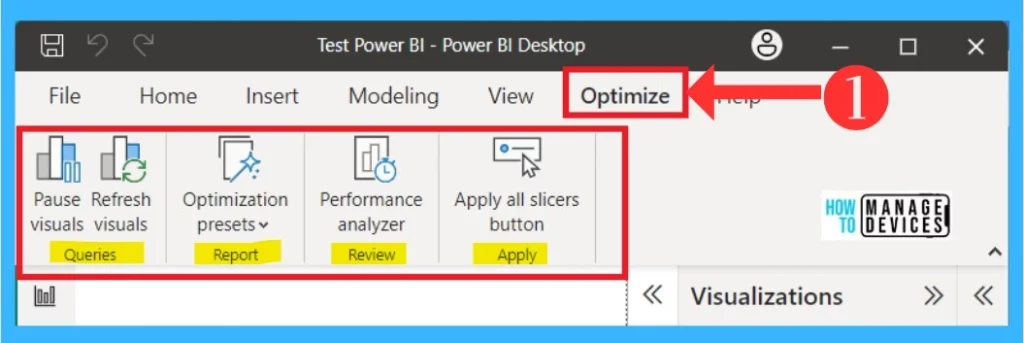
In the optimised menu it includes multiple options that are related to the report. It helps you to refresh your visuals or identify the areas for report improvement. In this Optimize option, multiple Ribbon menus will help you in the report section. The below screenshot shows optimize Menu.
- Select Optimize from the Home screen of Power BI Desktop
| Ribbon Menus | Use to |
|---|---|
| Pause visuals | Pause visual queries to make multiple edits fast without waiting for visuals to load |
| Refresh Visuals | Get the latest data with a one-time refresh, even when visuals queries are paused |
| Optimization presets | Optimize your report settings for interactivity or for query reduction |
| Performance analyzer | Assess your report’s performance and identify areas for improvement |
| Apply all slicers button | Apply all slicers button |
- Detailed Overview of Windows Steps Recorder Application
- Detailed Overview of Microsoft To Do Application
7. Help
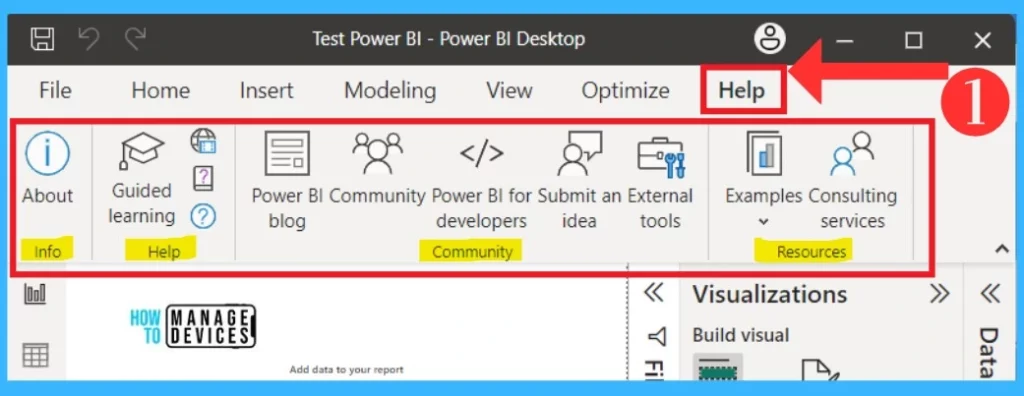
The Help Menu is the important one because it contains a lot of options that will help you to learn about Power BI report creation. You can easily Select the Help Menu from the Home screen of Power BI Desktop. In this help, you will get sample data for a tutorial to create a perfect report. The below screenshot shows the Help menu in the Power BI Desktop.
- About – See what version of Power BI you’re using and get session information (which is useful if you’re submitting a support ticket)
- Guided learning – Learn how to accomplish tasks and use different features in Power BI
- Training videos – Learn from Power BI experts on YouTube
- Documentation – Learn how to accomplish tasks and use different features in Power BI
- Support – Search for help with specific issues or report a problem
- Power BI blog – Learn about new features and read updates from our team
- Community – Connect, learn, and share with experts and peers in the Power BI Community
- Power BI for developers – Power BI for developers
- Submit an idea – Submit ideas for new features or make suggestions to improve existing ones
- External tools – Browse and download community tools that integrate with Power BI
- Examples – Get inspired by reports created by experts and download samples
- Consulting – services Browse workshops and other services offered by third-party consultants
Important Views of Power BI
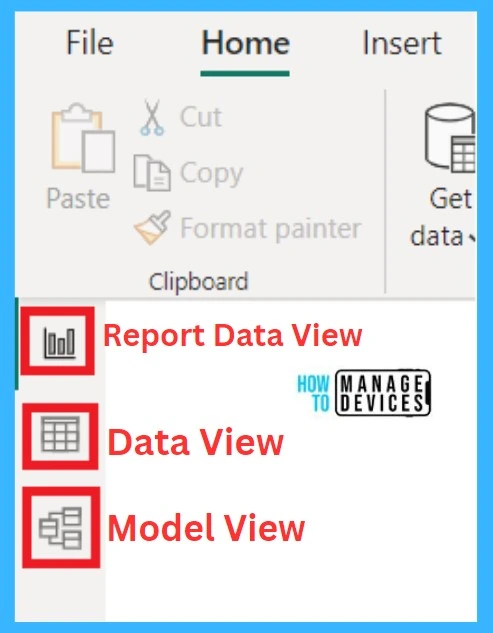
The Power BI has 3 Important views option that 3 option shows the actual result view in Power BI Desktop. You can select the View options from the left side of the Power BI Desktop page. The Views are given in the below table and screenshot.
| Views Type | Use to |
|---|---|
| Report Data View | With Report and data review, you can create reports and visuals |
| Data View | It shows tables and measures based on your data report and transforms it into the best report model |
| Model View | You can manage tables and data model relationship |
Filters in Power BI Desktop
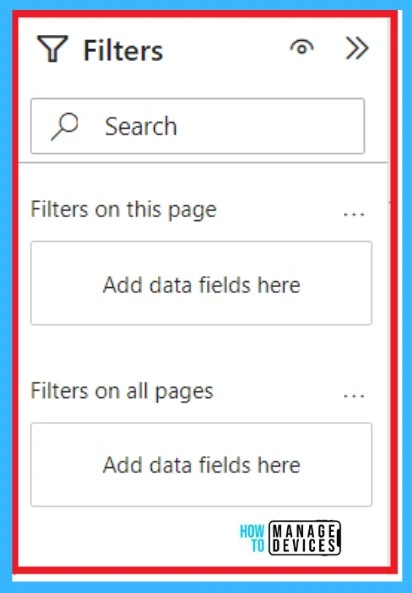
Filters are used to show any particular data by using the filter option. For example, If you want to see the top 6 profited items, you can use this filter option; it will be shown on the page. There is an option to add a data field to the filter. The below screenshot shows the filter option.
Visualization in Power BI Desktop
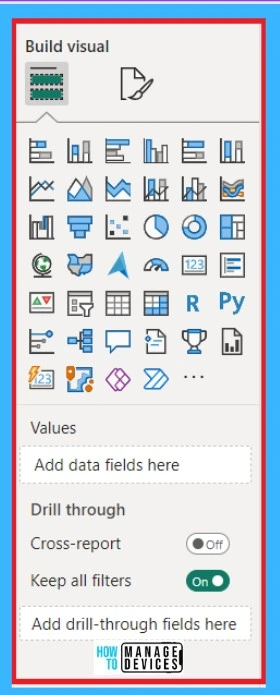
Visualization is the main core part of the Power BI desktop. In this option, you can select the design for your data report. In this option, there are many Graphs available you can easily insert any of them. With this option, there are many formatting settings for the graphs. The below screenshot and list show the Visualization option.
Data in Power BI Desktop
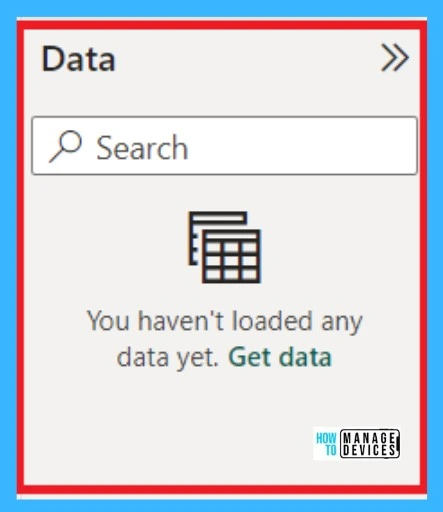
Data options are available on the right side of the Power BI page. Data options depend on the data that you entered in the Power BI. When you import data, this data option shows the heading of every sheet of imported data. The below screenshot shows the data option.
Creating Power BI Dashboard
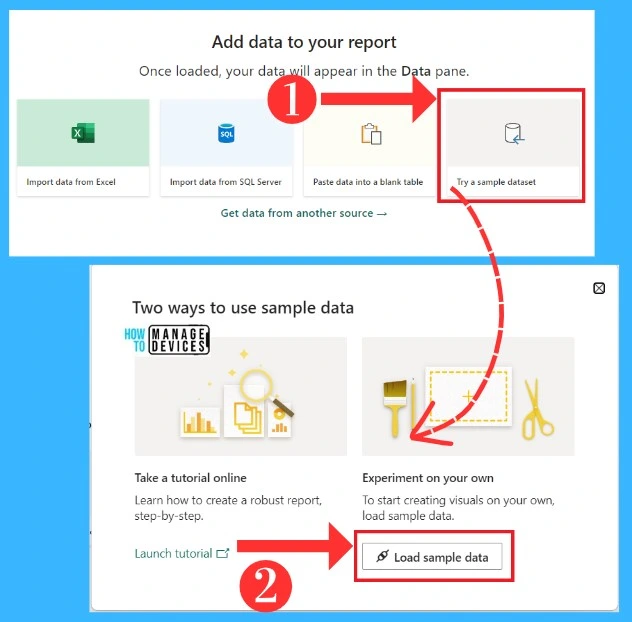
Here, I tried a simple Dashboard creation using simple Excel data. You can also try tutorial steps to know more about Power BI desktop and its advantages. In Power BI, there is an option to try sample data to learn and a link to try the tutorial.
If creating a Power BI report, you first have to name the Power BI page. The below screenshot shows how to get sample data.
- Click on the Try a sample dataset
- Select load sample data or Launch a tutorial
1. Name a Power BI page
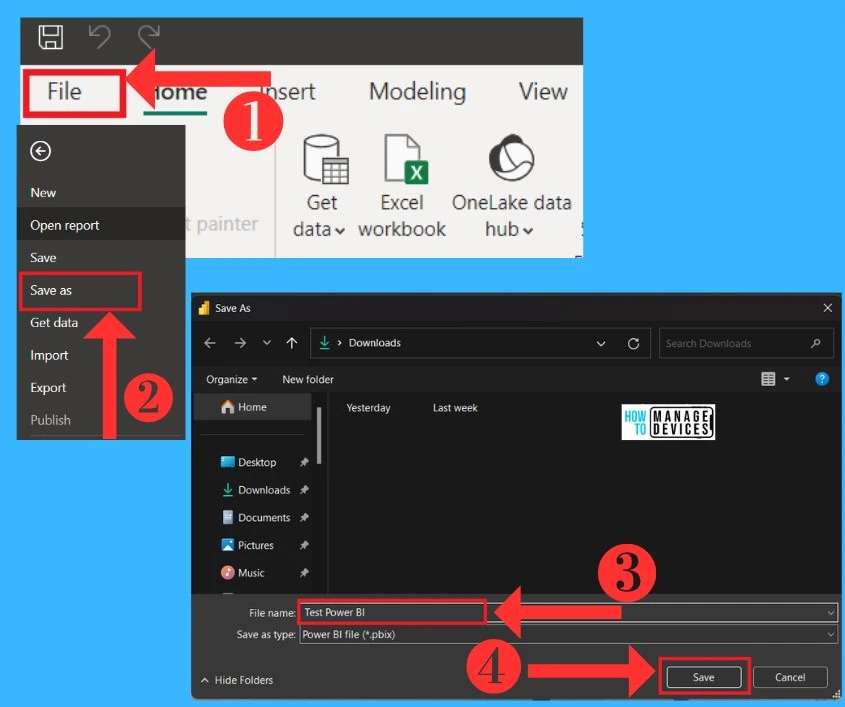
The First step is that you have to name the Power BI page that you open. When opening a Home screen of Power BI, you have to name the page using the File and Save option. Here I named Test Power BI. The below screenshot shows how to save a Power BI page.
2. Get Data
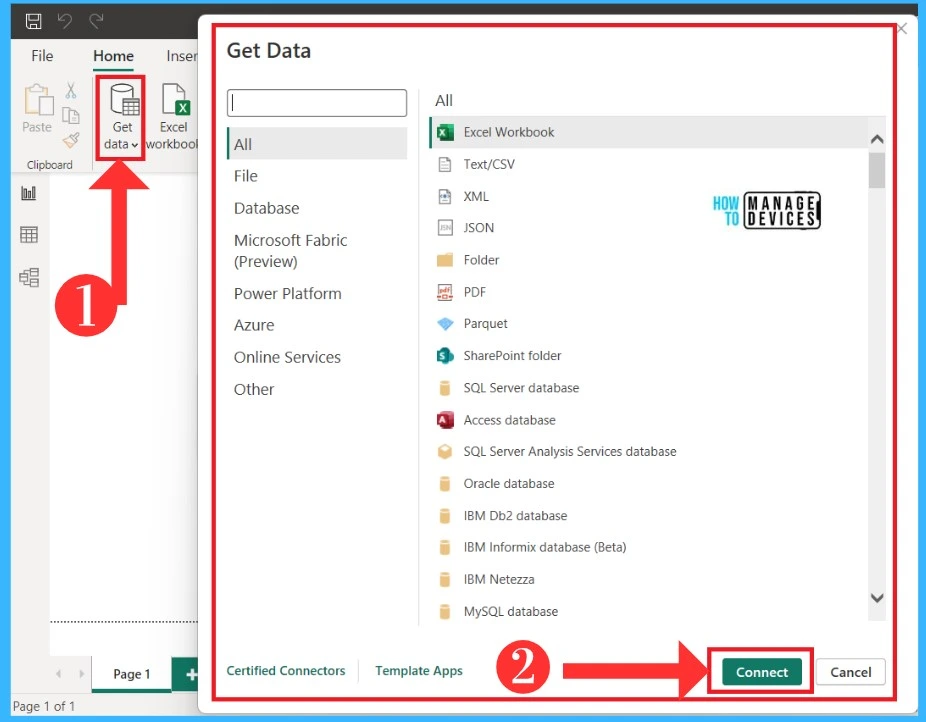
Getting data is an important factor in Power BI; Power BI Desktop is all about reports, modelling, visualization etc. Those reports are based on Data you give to the Power BI desktop for analysis. The get data option allows you to show the sources where you can connect to the data.
You can import data through these sources. You can get the ”Get Data” option from Home Menu, Get Started Window and also get it from the File menu. The below screenshot shows the Get data from Home Menu. Here I am trying Excel data.
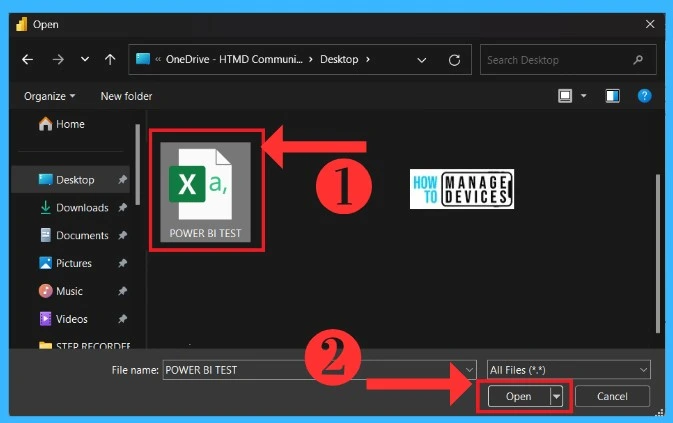
After clicking Connect, you can able to select your Excel workbook. Click on the Excel workbook and open the Power BI page. The below screenshot shows the process of importing Excel data.
3. Navigator
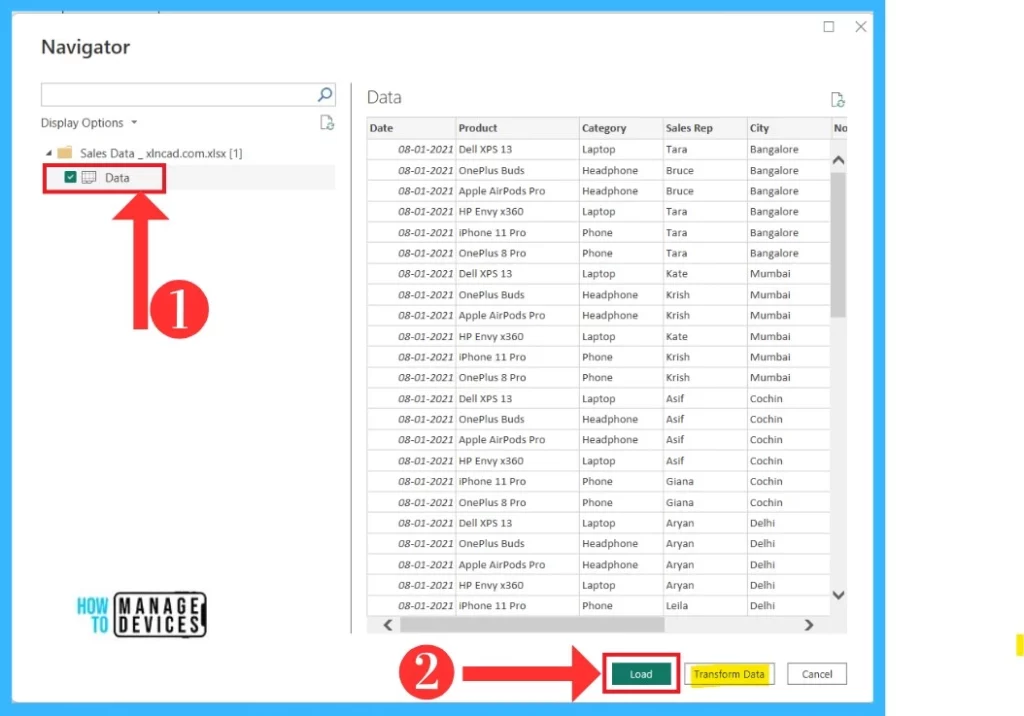
After the importing data process, Power BI opens a Navigator dialogue box, where you can load your data. Here you can make sure the information depends on your data. The navigator box also provides a transform option to help you make changes in the Excel sheet.
If you don’t need any changes in data, you can click on the Load option to load the data to the Power BI page. The below screenshot shows the Navigation stage.
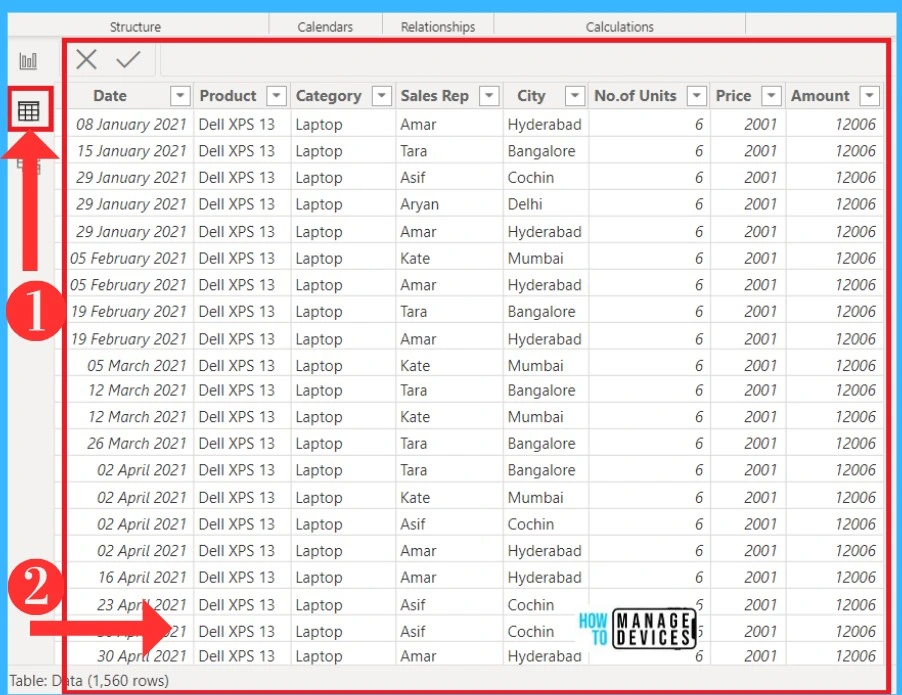
After clicking the Load option, the data will load to your Power BI page. You can able to understand the changes after successfully importing the data. The below screenshot shows the page on a Report View basis after importing data to Power BI Desktop.
Data View after Importing Data
You can see the entire data in Power BI Desktop in the Data view. Here you see the tables and measures to transform the data for best use in the report’s model. The below screenshot shows the data View of the Power BI after importing data.
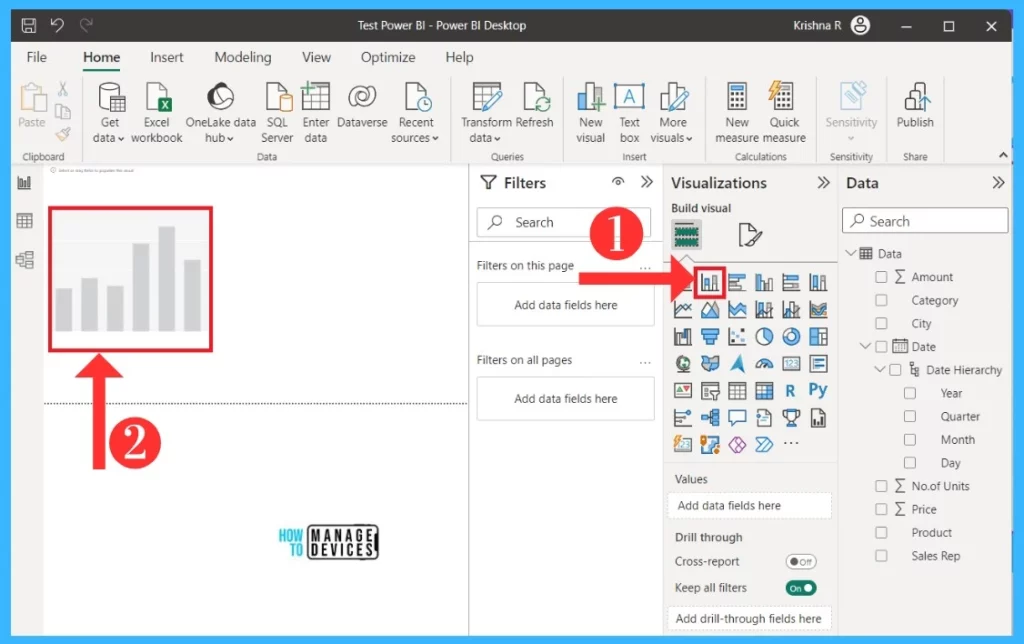
How to Create a Graph Based on Data
In this tutorial, I am showing you simple data from Excel; with this data, I will show you the dashboard report. First, I created a chart based on sales details from January to December. For this process, you must select any graph chart and drag the one you want.
- Click on any chart from Visualization here; I selected the Stacked column chart
- Drag the Chart to fit the screen
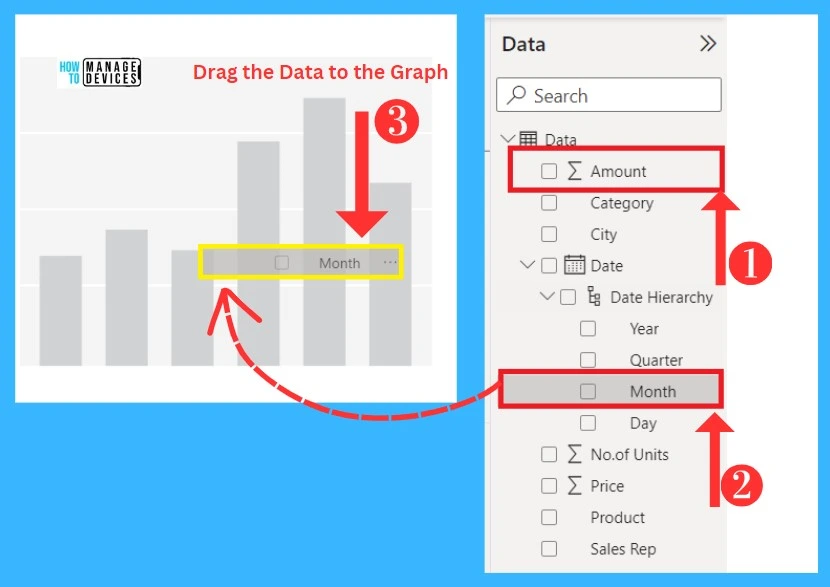
After clicking Chart, you are now ready to add data to the Chart. In this Chart, I will add the Month and the Amount. You have to click on the Data option and expand the data field. The below screenshot shows how to add the Month and amount to the Chart.
- Click on the Data and Expand the Data Field
- Click on the date and Date Hierarchy and select the Month
- Drag the Month and Amount and drop them into the Chart
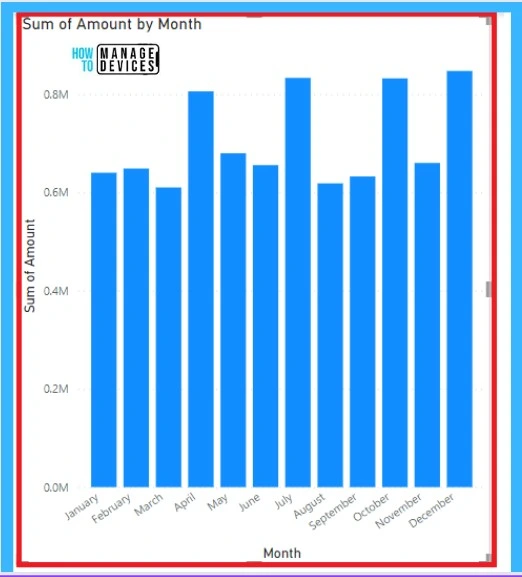
After dropping the amount and Month, you will get a chart representing the sales figure from January to December, but it does display the amount. The below screenshot shows the sales figure based on Amount by Month.
Format Your Visual
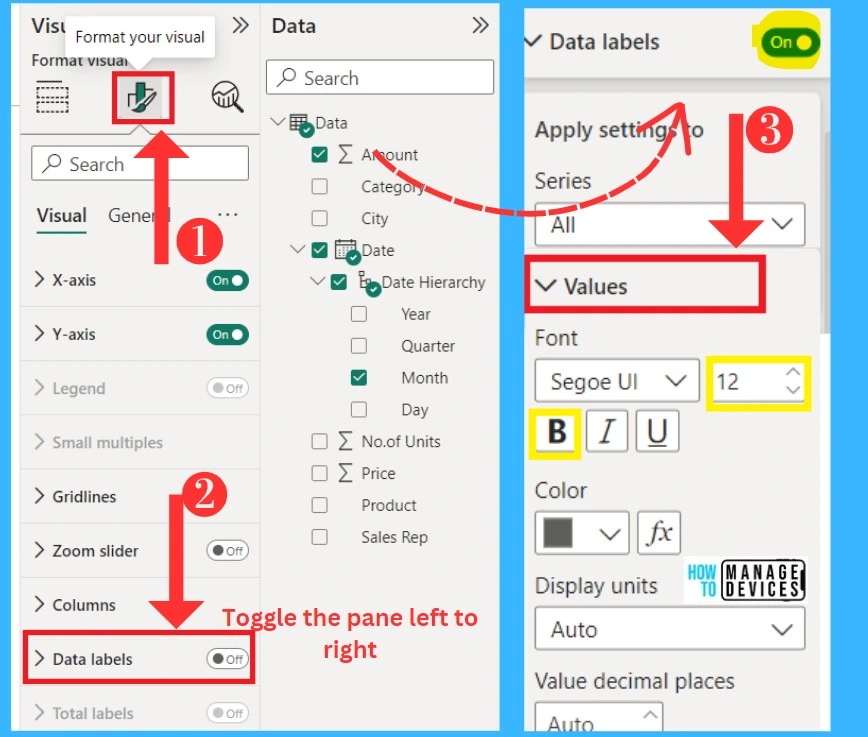
In the sales chart, we have to add the amount to display on the Chart. For this process, first, we need to click on the Visualization field, the Format your Visual option, select Data Labels, and toggle the pane from left to right.
Then we need to change the chart font size, so first, we need to click on the Values option. With this Value option, Resize your font size, and you can also bold the font.
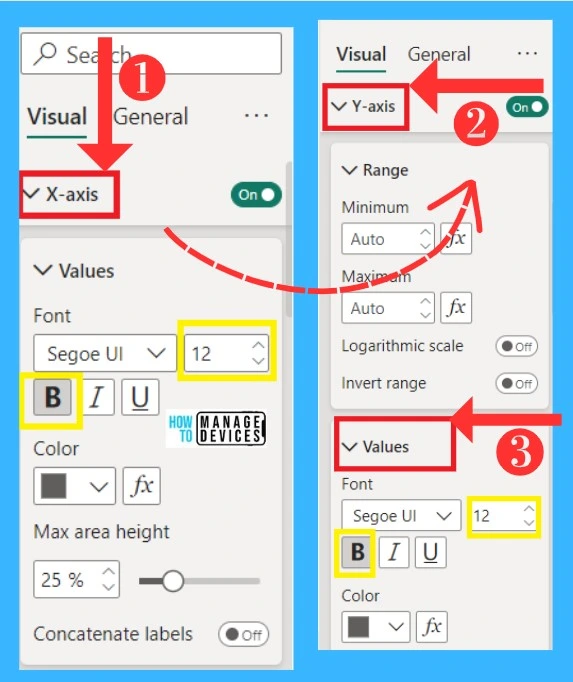
After the Font size settings, we must increase the vertical and horizontal axis sizes. For this procedure, select the Y and X axes and do the same procedure we did in the font size.
The Result of Sales Amount by Month
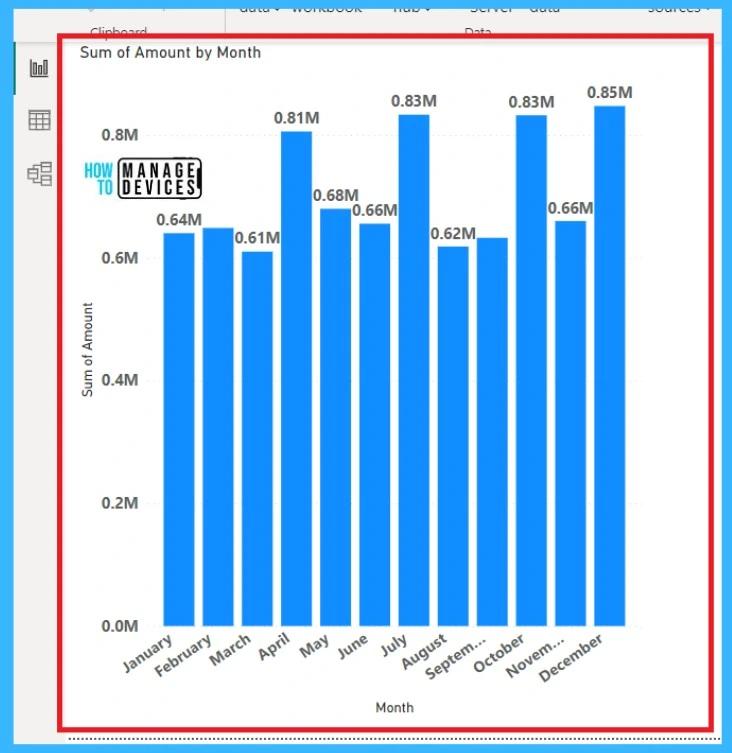
In the final result, you can see the Sales data on a monthly basis. You can do more with this data, and also you can add different kinds of charts to this page, and you can add more data like Product details, sales categories etc. The Below Screenshot shows the Final result chart.
- How to Customize Taskbar Behaviors in Windows
- Latest AI Features of Microsoft Edge Browser | Game Changer
Format Painter
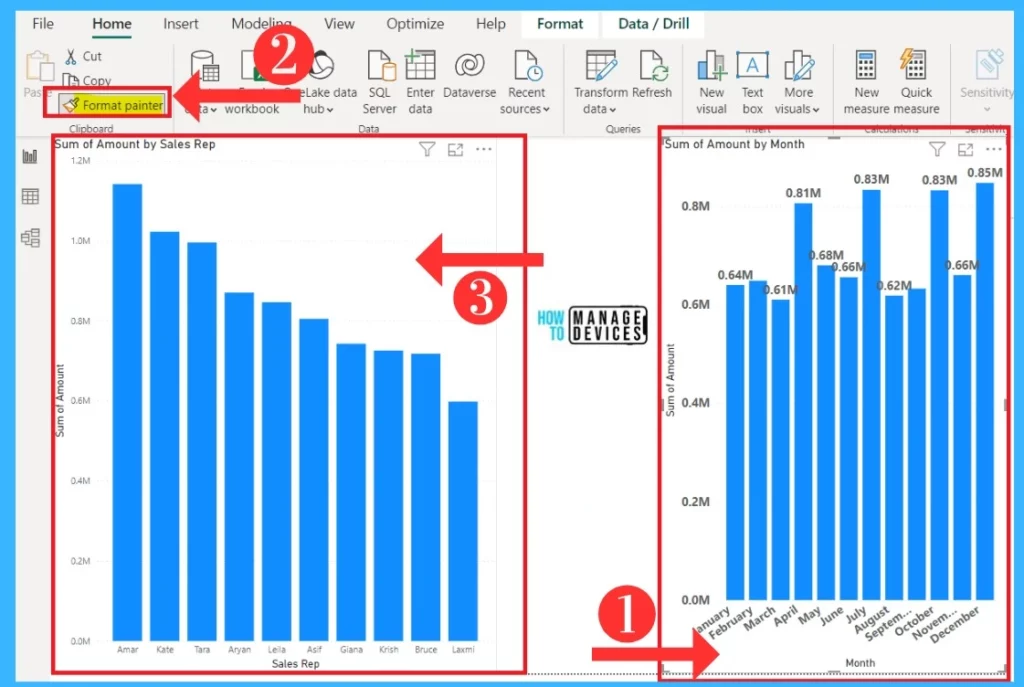
Format Painter is an important tool in Power BI. It’s coming under the Home Menu. This option is much needed when you want to add data from one chart to another. Here I created another chart by using data for sales reps and amount.
If I want data from one chart to a new chart, click on the existing chart for selection, click on the Format Painter, and then click on the chart for importing data. The below table shows the format paint process.
- First, Click on the amount by month Chart
- Click on the Format painter
- Click on the Sales Rep chart
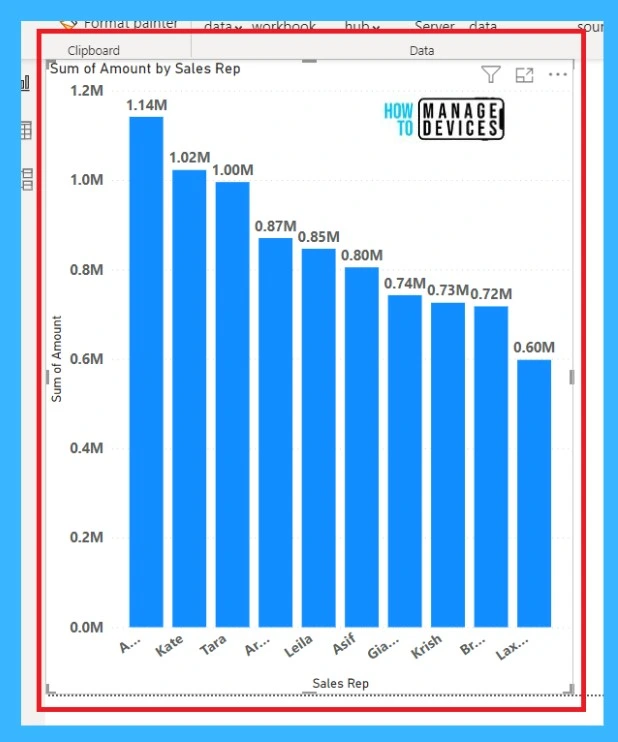
After Clicking Format Painter, The fonts are more visible on the screen. This option will help you to add information from one chart to another. When you click on any chart cells, that will only show the particular details in the chart. The below screenshot shows the chart after using the Format painter
Filter Option Changes after Enter a Data
Filter option is an important option in Report making. With this option, you can filter the visual reports on the basis of data. For example, you can filter the visual by the amount of high to low. The filter options contain the data field. You can add data to the data file, which will show in the chart. The below screenshot shows the filter option.
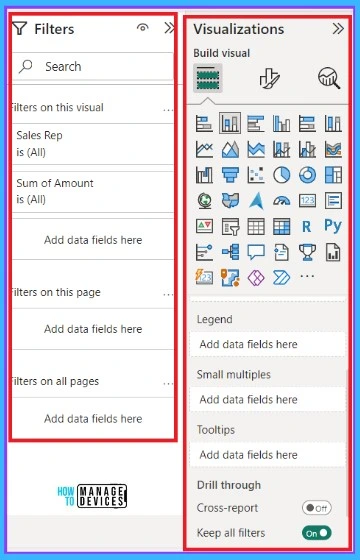
Visualization Option after Enter a Data
Visualization includes many options for data visualization. So many charts are available in this option; you can select any of them. With this option, you can do so many changes to the chart. In visualization, you can add colour to the canvas background, and it allows you to create a title for the visuals.
| Visualization Option | Use to |
|---|---|
| Legend | Contains description for each (add data field here) Category |
| Small multiples | splits a visual in multiple version |
| Tool Tips | It acts as an analytical tool to visualize additional information about the report |
| Drill through | It acts as an analytical tool to visualize additional information about the report |
| Cross report | It helps contextually jump from one report to another report in the same Power BI service workspace |
| Keep all Filters | It helps to keep all applied Filters when this option is On |
The Final Result of Dashboard creation
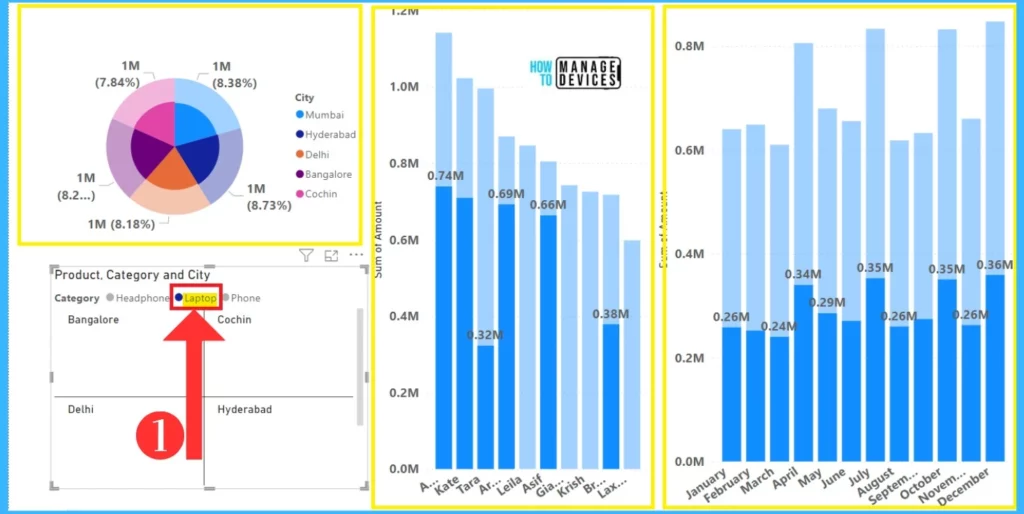
As I mentioned above, I used simple Excel data to show how to create Dashboard in Power BI. With the data, I created some Pie charts, Line charts by using Product, City Amount and Sales Rep name. Also, I used Format Painter to copy data to another chart. The below screenshot shows the final result of the dashboard creation.
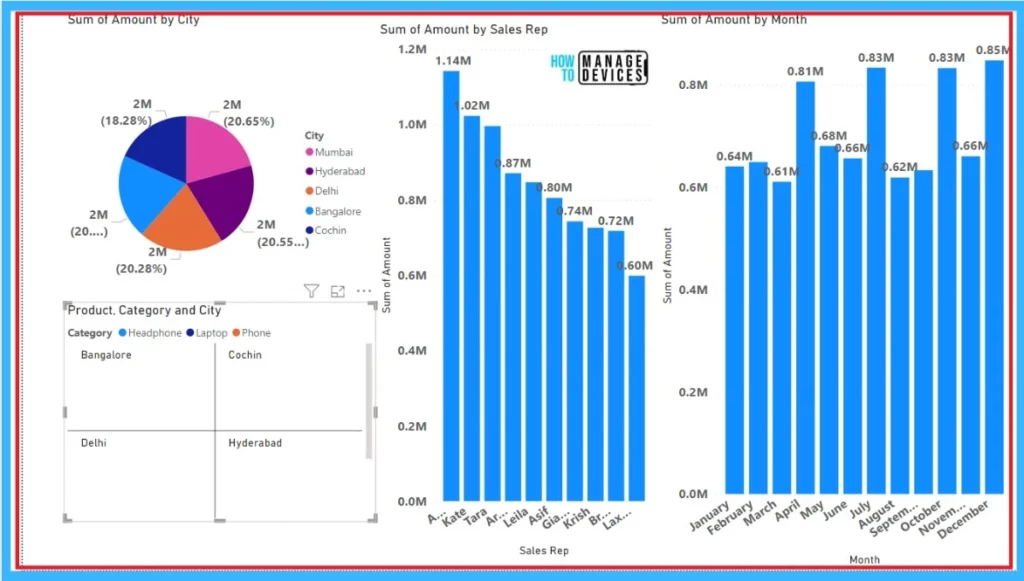
The main advantage of the Power BI desktop is that you can filter those chart visualizations. For example, if I click on a particular product in any of the charts, it shows the details of that chart. Here I clicked on the Laptop, so the charts only show the laptop product details. The below screenshot shows the Filter visualization.
Settings Of Power BI Desktop
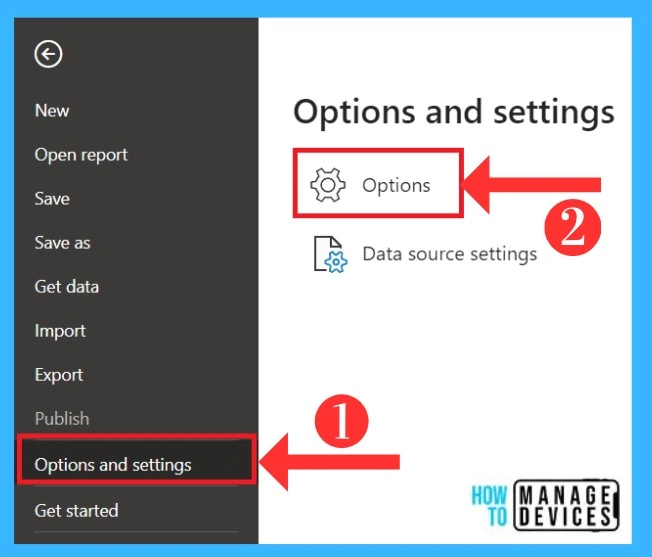
Settings are a very important factor in Power BI Desktop. In the Settings option, there are 2 sections one is Global, and the second one is Current file. These 2 actions contain many setting options. The below table and screenshot show the Setting options.
- Click on the File Menu and select the Options and settings
- Click on the Options
| Options | Use to |
|---|---|
| New | It helps to open a new page |
| Open Report | It helps to open Reports that you previously worked |
| Save | It allows you to update previously saved files with new content |
| Save as | Save as allows you to save to a new location with a different name |
| Get data | Getting data to help you to open data sources to connect with Power BI |
| Import | It helps you to Import data to the Power BI |
| Export | It allows you to Export data from Power BI |
| Publish | help you to Publish the Power BI report |
| Options and Settings | help you to open Power BI settings and Data sources settings |
| Get Started | It allows you to open the Get Started welcome window |
- Data Load
- Power query editor
- Direct query
- R Scripting
- Python Scripting
- Security
- Privacy
- Regional Settings
- Updates
- Usage Data
- Diagnostics
- Preview features
- Auto recovery
- Report Settings
- Data load in the Current file
- Regional Settings in the Current file
- Privacy in the Current file
- Auto Recovery in Current file
- Published dataset settings
- Query reduction
- Report Settings
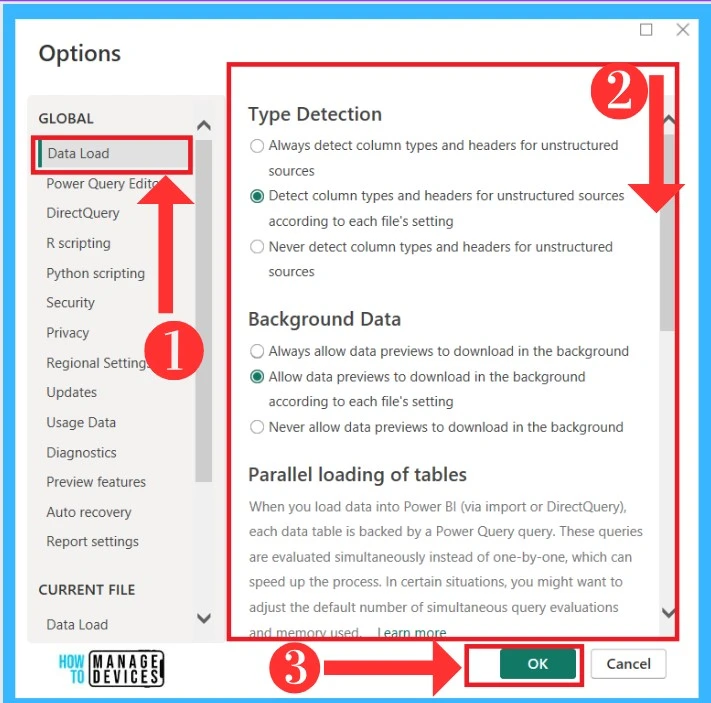
1. Data Load
The Data load option is the first setting option in the global category. The data load option allows some setting options about Type detection, background data and parallel loading of labels etc, you can enable or disable it. The below screenshot shows the Data load settings.
2. Power Query Editor
Power Query editor allows you to connect with one or more data sources. Modifying data shapes and transforming data to meet your needs is very useful. It allows settings for layout parameters, formula, data import and Data preview. The below screenshot shows the settings of the Power query editor.

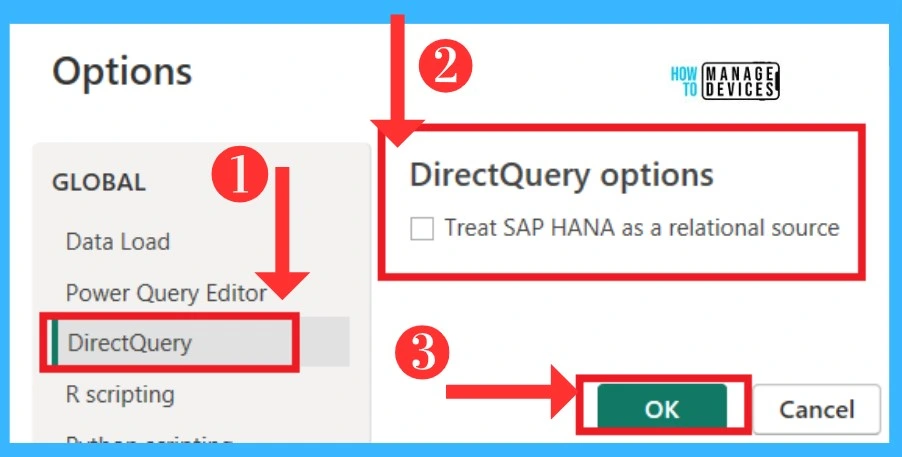
3. Direct Query
In Power BI, you can connect data from different sources, but in Direct Query, connect data Directly. Direct Query allows an option to treat SAP HANA as a relational source, and you can allow the option if y you need it. The below screenshot shows the Direct query option.
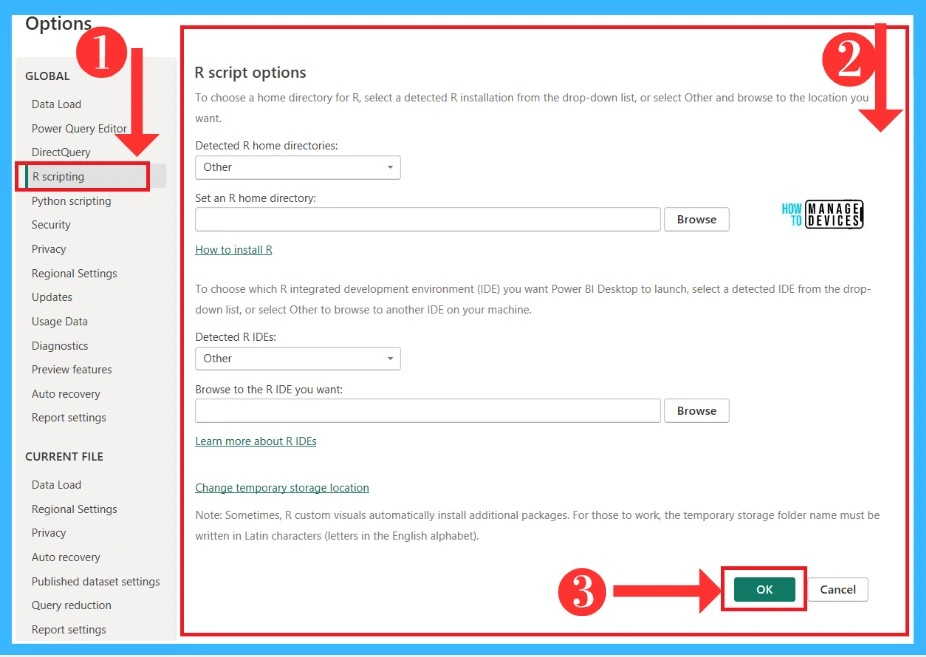
4. R Scripting
You can do R Scripting in Power BI using just a few steps for it. To run an R script in Power BI, you can create the script in your local R development environment. There are many options to do R scripting in Setting. The below screenshot shows the R Script options.
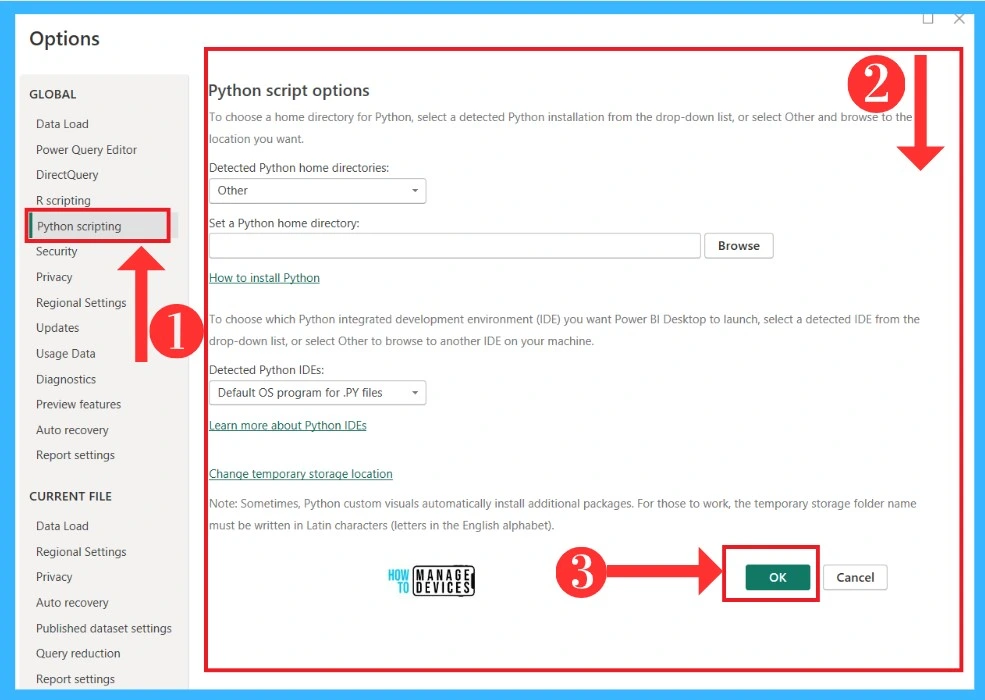
5. Python Scripting
Power BI is allowed to integrate with Python Scripting, which will help it reach the next level. You can enable Python Scripting through the settings options. The below screenshot shows the Python options in settings.
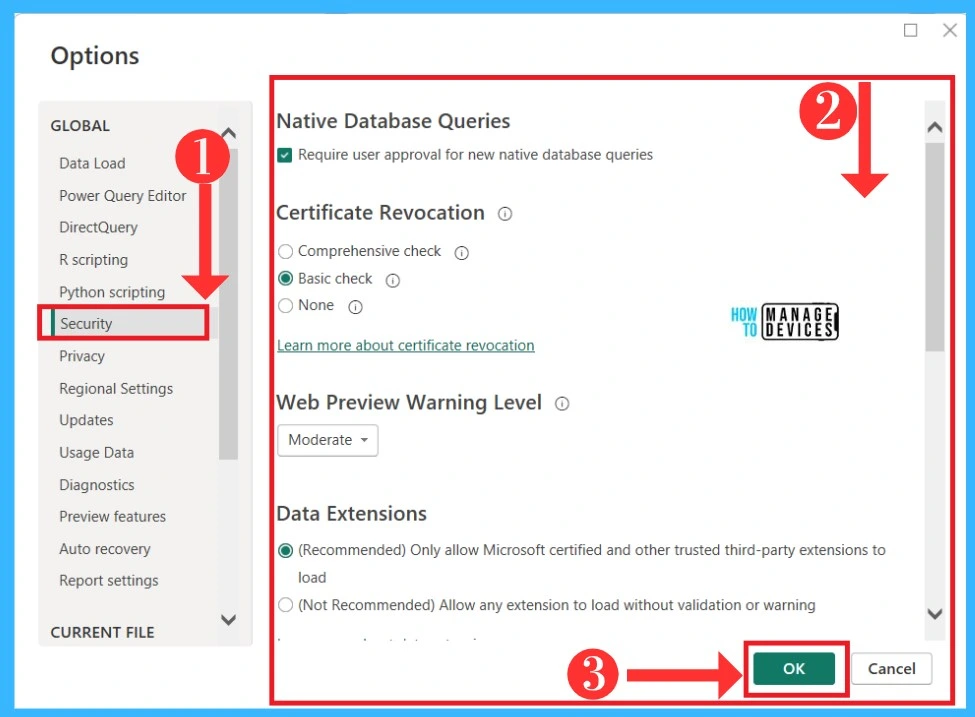
6. Security
Security is an important one in PowerBI desktop. In the security option, it allows many options in security settings. You can select security options from Settings. The below screenshot shows the security option in Power BI Desktop settings.
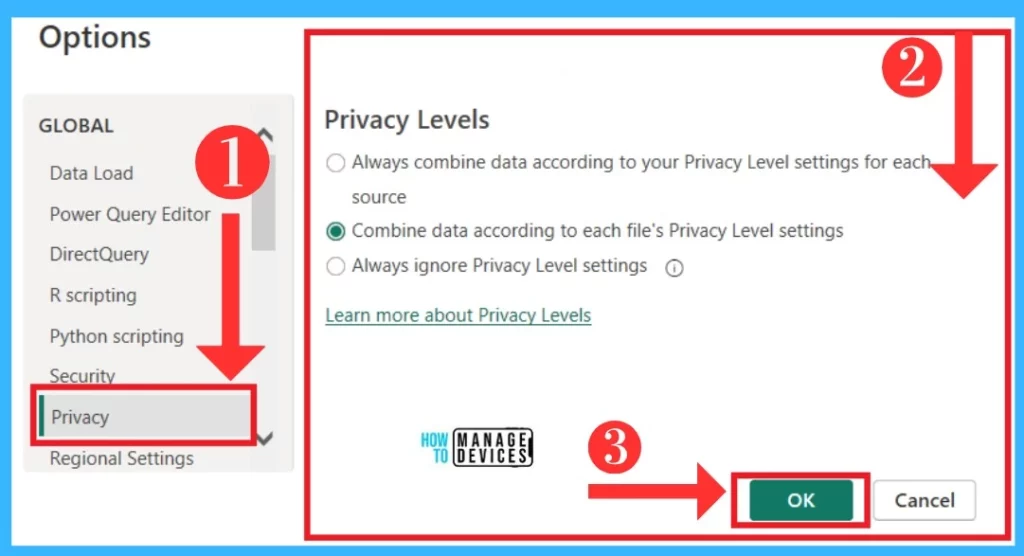
7. Privacy
Privacy settings in 3 types in Power BI Desktop Private, organizational and public. With these privacy settings, you can set private data sources apart from other data. The below screenshot shows the Privacy level options.
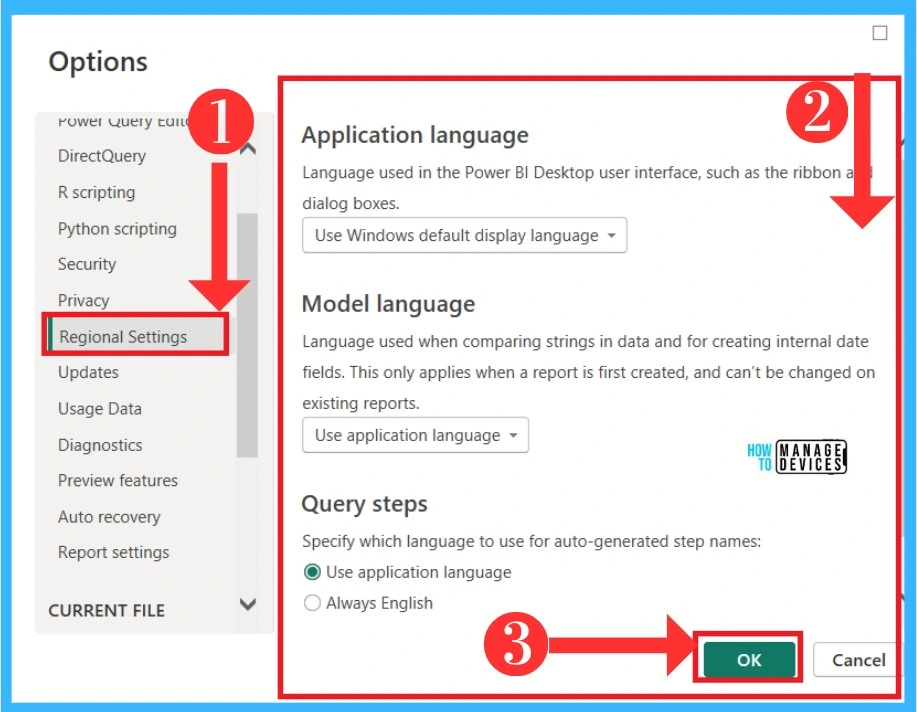
8. Regional Settings
Regional Settings allows language options to Power BI Desktop. You can select user interface language for ribbons and boxes in these settings. It also allows Model language and Query steps. The below screenshot shows Regional Settings.
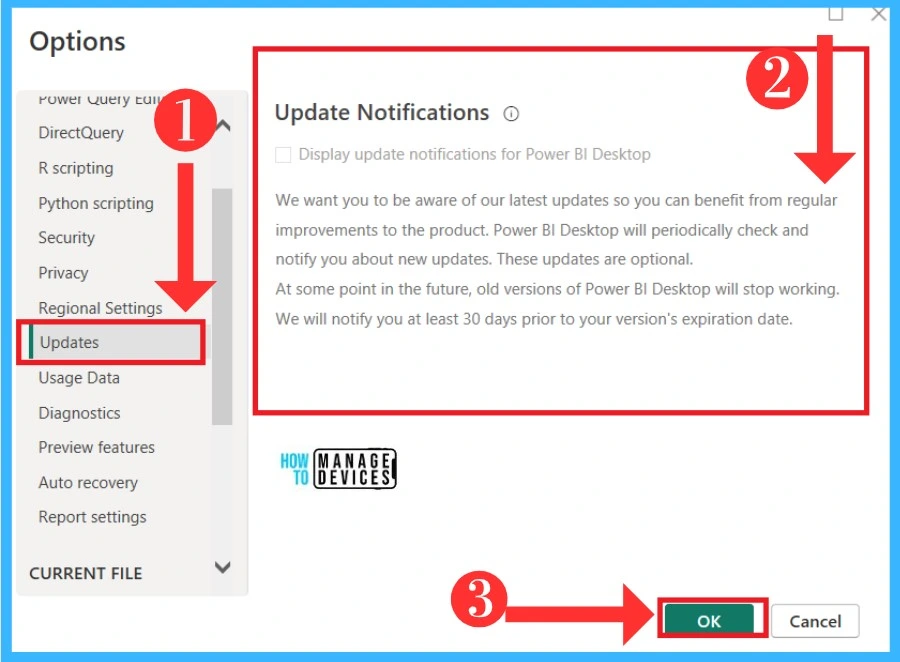
9. Updates
Updates are always important everything. The Power BI always support new updated version. This Update option gives you the New Updation Notification. The below Screenshot shows the Update option.
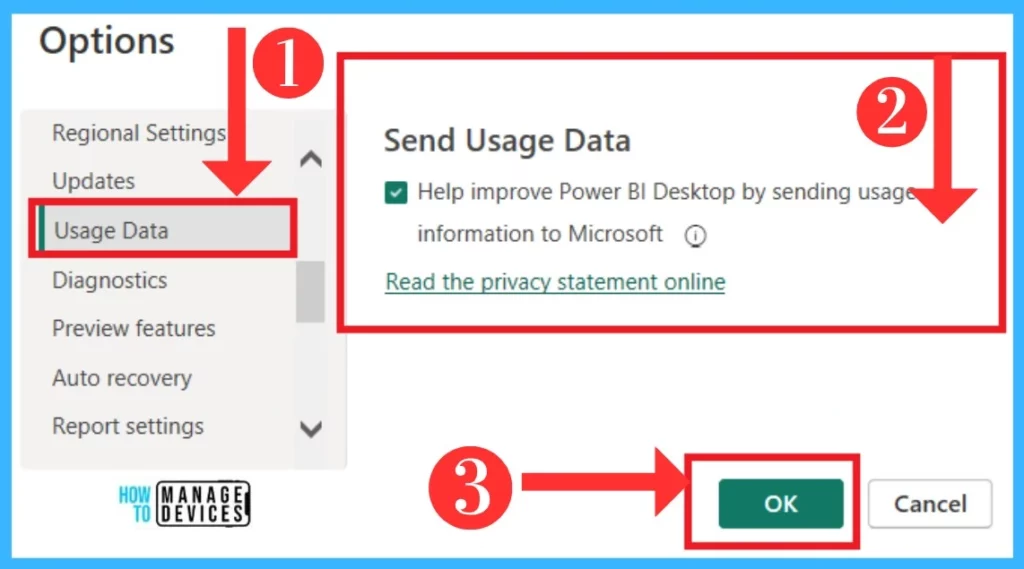
10. Usage data
This option helps to Send usage data to improve Power BI Desktop by sending information to Microsoft. You can allow this option by enabling the options. The below Screenshot shows the Usage data option.
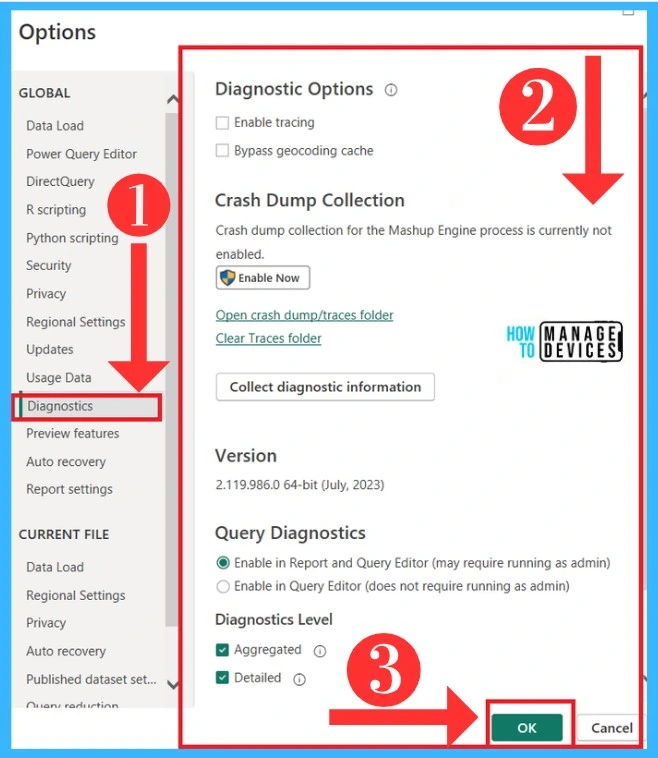
11. Diagnostics
Diagnostics provides summarized and detailed Views for Power BI. The Diagnostics option allows many options like crash dump collection and Query Diagnostics. The Diagnostics version help to show the version details in this option. The below screenshot shows the Diagnostics options.
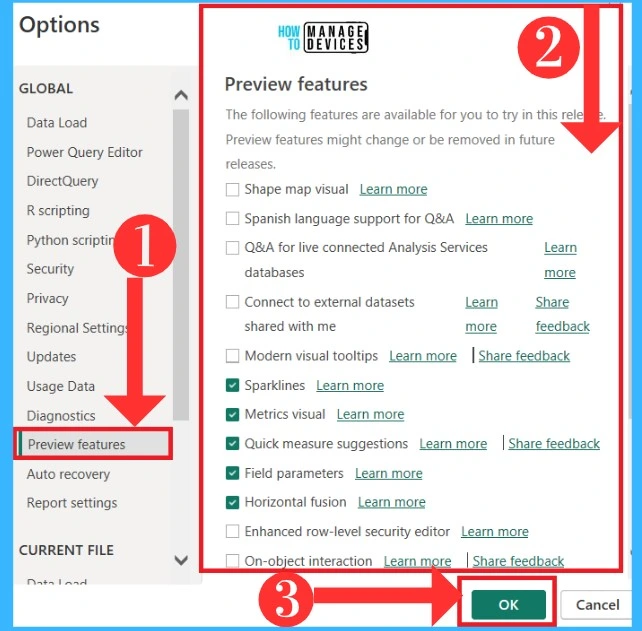
12. Preview features
Preview features in Setting for the preview of Power BI options. This option gives you many options for creating better Previews for your map visuals etc. There are many options in the preview feature, some of them toggled on by default. You can make changes by enabling your preferences.
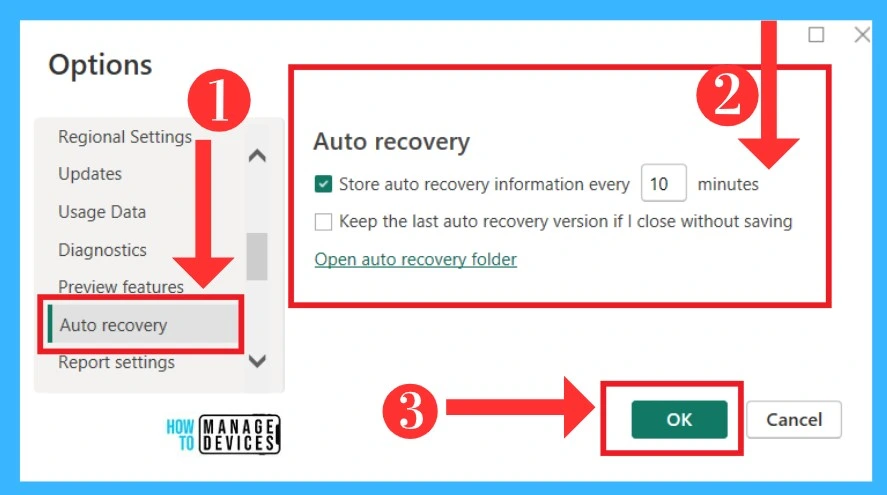
13. Auto recovery
In Power BI, Desktop saves Auto recovery files by default. When a user closes the file without saving it, it will save a copy under the Auto Recovery options in Power BI Desktop. The below screenshot shows the Auto Recovery option.
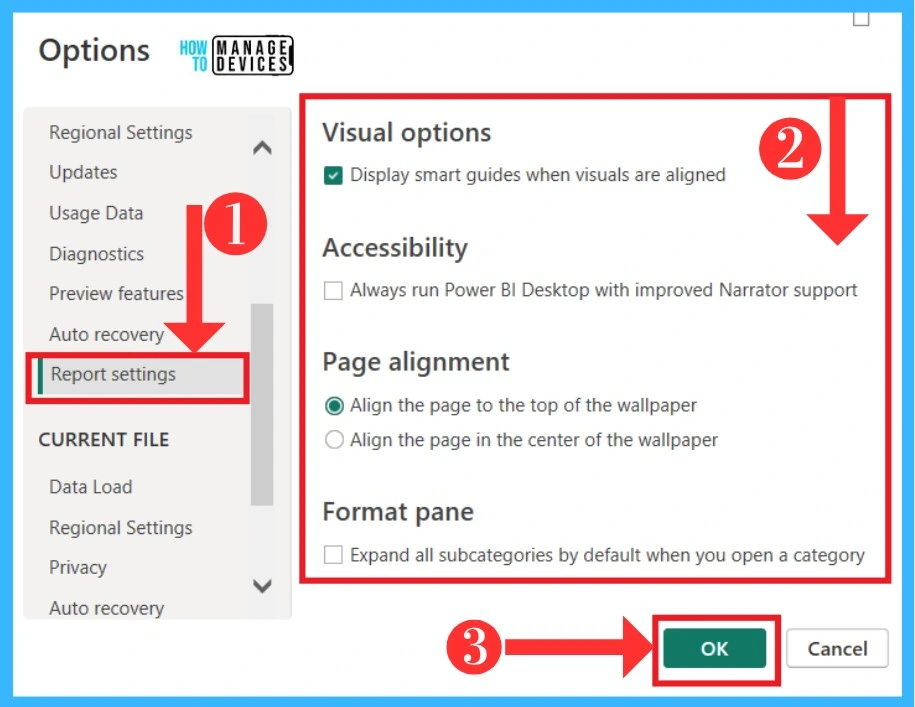
14. Report Settings
Report setting, you can customise visuals and page alignment. In this setting option, there are 4 options is included actability visual option, page alignment, and format pane. There are many of the options are on by default. The below screenshot shows the Report settings.
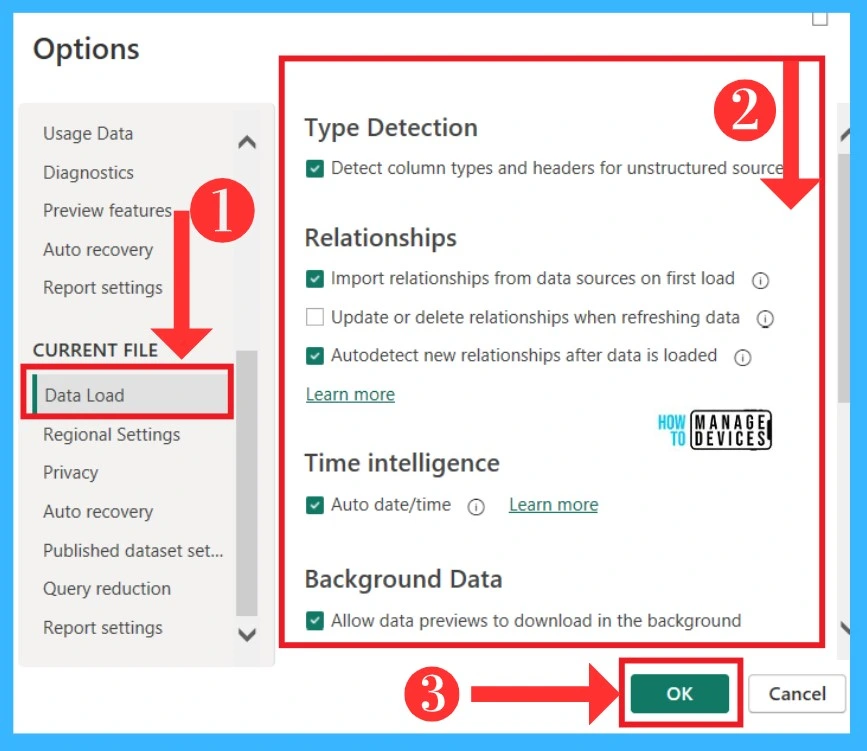
15. Data load in the Current file
Data loading is very important because data are very important to create a report. When you load data, it will give you the option to load or transform. In data load settings, you can allow Relationship settings for data, and it will give you the option to enable Time intelligence. The below screenshot shows the Data load setting option.
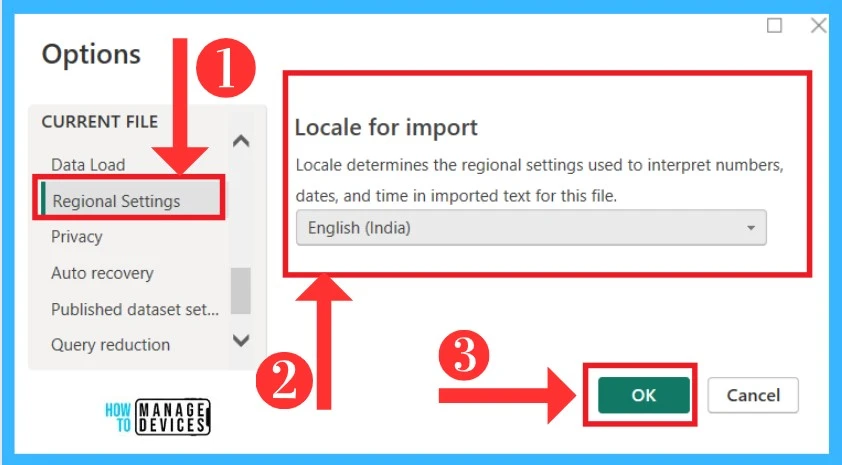
16. Regional Settings in the Current file
Regional Settings allows language for a locale for import. This option gives you the language option for interpreting numbers, dates and times in imported text for the file. There are many language files available for this. The below screenshot shows the Regional settings in the Current file category.
17. Privacy in the Current file
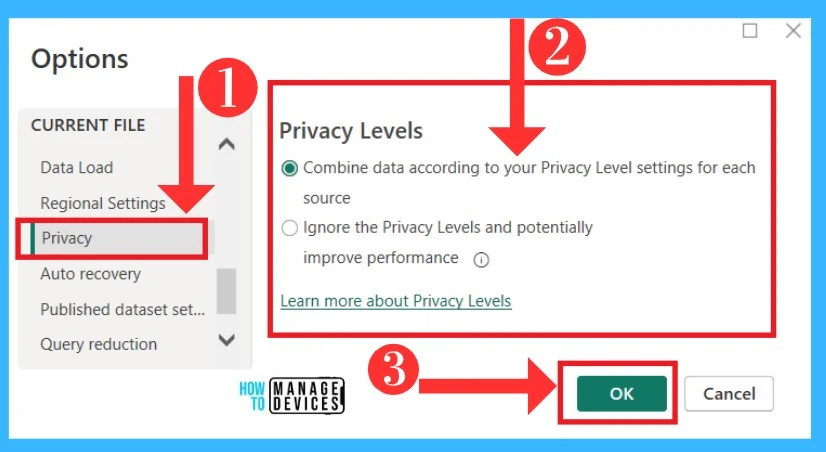
Privacy is everyone’s concern in entering data into Power BI. In the current file option, Privacy level settings have 2 options. Combining data according to privacy level setting is the one option in this settings that is on by default already. The below screenshot shows the Privacy settings.
18. Auto Recovery in the Current file
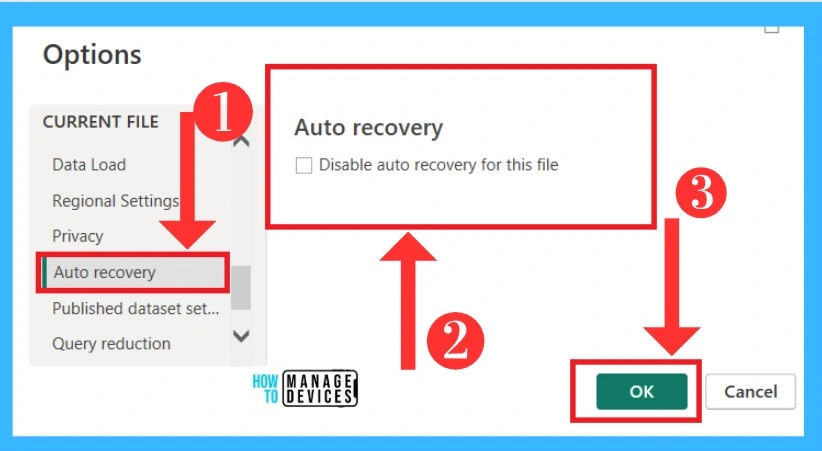
Power BI allows an Auto Recovery option; when a user closes the page without saving, it will save a copy to the Auto Recovery option. In these settings, you can enable the option to save an auto-recovery option to save a file copy. The below screenshot shows the Auto Recovery Settings.
19. Published dataset settings
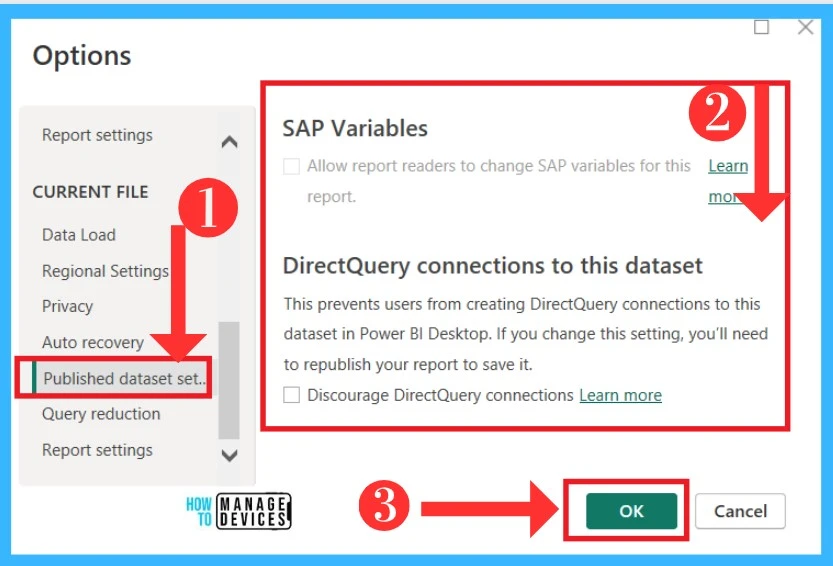
In the Published data set, it gives you the option to allow SAP variables option. Also, give the option to prevent the users from creating direct query connections to the data set. The below screenshot shows the published dataset setting options.
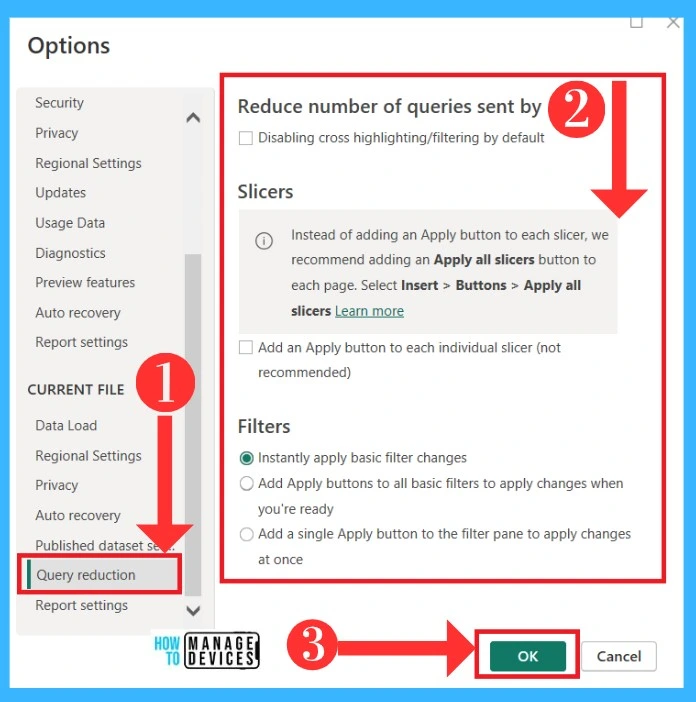
20. Query reduction
The Query Reductions are very useful when a query report takes a long time to run. Here you can set your needs. The below screenshot shows the query reduction option.
21. Report Settings
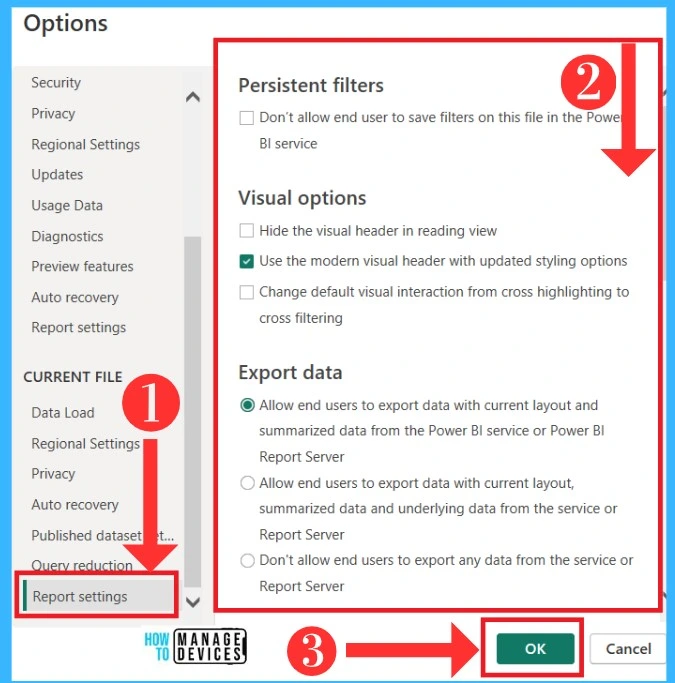
Report settings contain a lot of options in Power BI Desktop. This settings option is only for report settings, so these options make report settings better. There are many options provided for this settings visual option, export data, personalize visuals etc. The below screenshot shows the Report setting option.
Author
Krishna. R is a computer enthusiast. She loves writing on Windows 11 and related technologies. She likes to share her knowledge, quick tips, and tricks with Windows 11 or Windows 10 with the community.
