Let’s learn about the SCCM Task Sequence Debugger feature. Starting with SCCM 2203, the Task Sequence debugger features are no longer pre-released. This is the ultimate and best tool for debugging the SCCM Task Sequence.
Hello, everyone. Let’s discuss how to Troubleshoot the ConfigMgr Task Sequence with the Debug option. Using task sequence debug, an SCCM administrator can easily troubleshoot the OSD deployment. Let’s see how the Debug Option can help you troubleshoot the Task Sequence.
Also, by applying Task Sequence Debug, you can control and troubleshoot any task sequence deployment—this task sequence debugger you can mainly use for testing purposes.
However, make sure that when you use a task sequence debug, it is deployed to a smaller group of device collections.
Table of Contents
Debug Task Sequence Related Queries
Vimal has another post on this topic, in which he discusses enabling the Task Sequence Debugger using the Task Sequence variable.
Is the Debug Task Sequence Option available for all SCCMs?
Yes. The minimum client version should be 1906
Where is the Debug Task Sequence Option?
Operating System – Task Sequence node
Debug Tool is an additional tool that needs to be installed separately.
No. It’s integrated into the Console by default.
SCCM Task Sequence Debugger
SCCM CB version 1906 introduced the task sequence debugger, a new troubleshooting tool. An administrator can deploy it into a small collection to troubleshoot the OSD.
By deploying this task sequence, debug will allow an administrator to control each task sequence step to troubleshoot and investigate the issue. Task sequence debugger can be run on the same device during the task sequence deployment, not on a remote device.
Let’s discuss the prerequisites for using the Task sequence debugger below.
Pre-requisites -SCCM Task Sequence Debugger
- Make sure ConfigMgr clients are upgraded to the above 1906 version.
- The task sequence debugger can be run if you log in as an administrator on a particular device.
- If deploying an OSD task sequence, ensure your boot image is updated with the latest ConfigMgr client.
How to Use Task Sequence Debug Tool
Let’s try to use the SCCM Task Sequence Debugger tool using the following method.
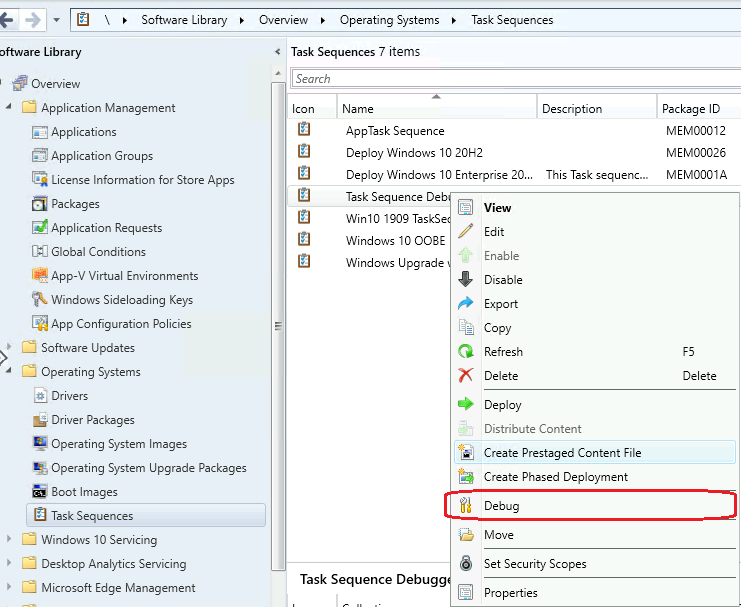
- In the ConfigMgr Console, go to Software Library, expand the Operating Systems and select Task Sequences.
- Select the task sequence you want to deploy using the ‘Debug‘ tool.
- Then ‘Right-click‘ on the task sequence and select ‘Debug.‘
Select the collection for debugging deployment and click ‘Next‘.
Note: The task sequence debug deployment option only displays 10 or fewer members of device collections.
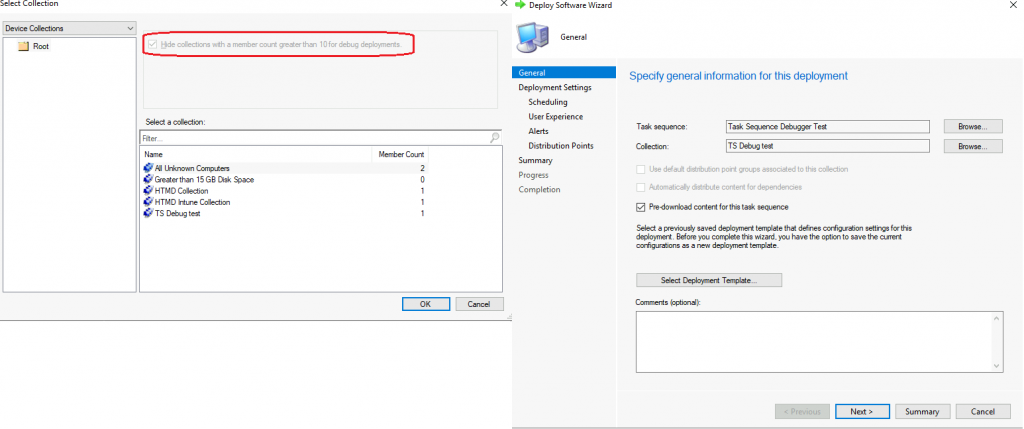
According to my testing, you cannot use debug for the required deployment. The option was gyred out.
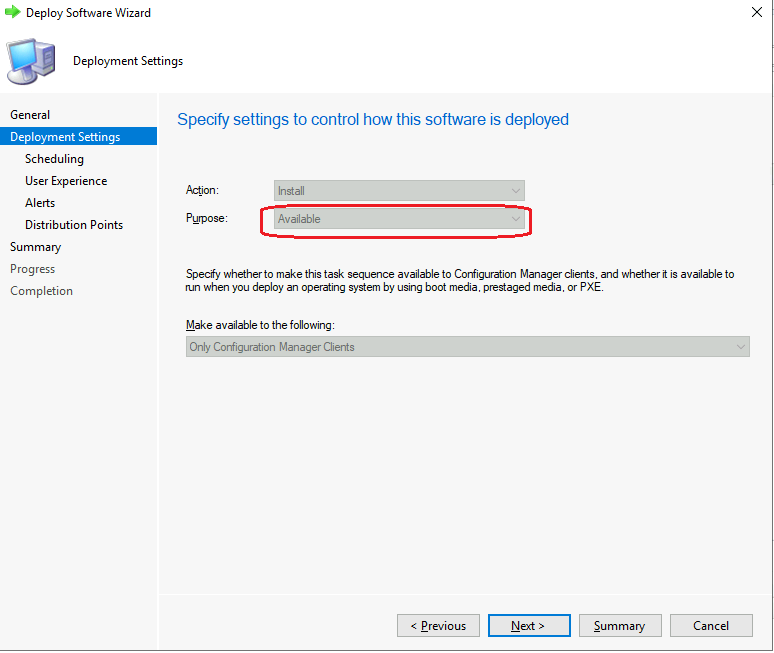
Click ‘Next‘ -> schedule the deployment and click ‘Next‘. In the ‘User Experience‘ section, I noticed that you cannot uncheck the option for “Show Task Sequence Progress.”
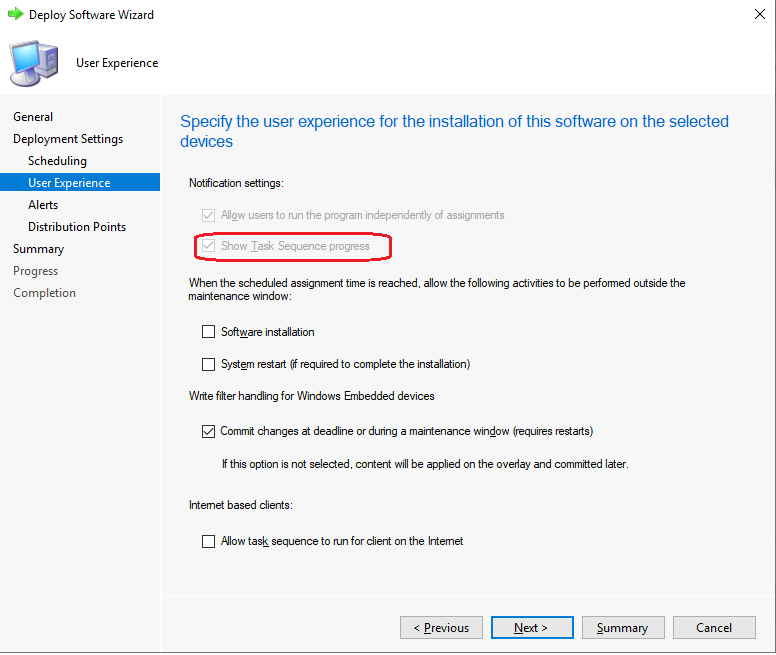
Click Next -> Next to finalize the deployment. Once the task sequence deployment starts on the machine, the Task Sequence Debugger window will open.
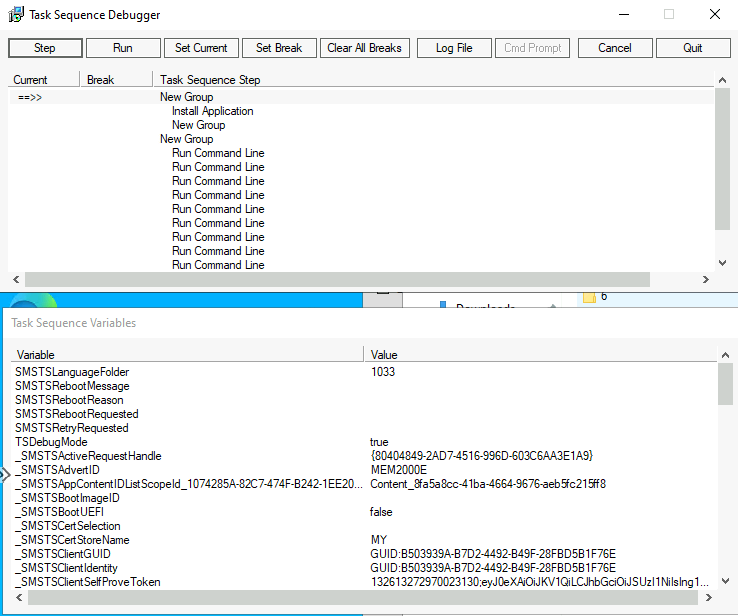
Options SCCM Task Sequence Debugger | The Tool to Debug TS
The below controls are included in the debugger tool. SCCM Task Sequence Debugger | The Tool to Debug TS tool options.
- Step: You can run the next step of the task sequence from the current position.
- Run: If you set a break in any step of the task sequence, then click on run to proceed.
- Set Current: Select a task sequence step and select Set Current. This action moves the current pointer to that step, allowing you to skip steps or move backwards.
- Set Break: Select a task sequence step in the debugger and then select Set Break. This action adds a breakpoint to the debugger, and when you run the task sequence, it stops at a break.
Another list of additional features is included in the SCCM TS Debugger tool.
- Clear All Breaks: It will remove all breakpoints.
- Log File: It will open the task sequence log file smsts.log in the CMTrace tool.
- Cmd Prompt: If you deployed a task sequence with WinPE, it will open a command prompt.
- Cancel: It will close the debugger, and the task sequence will fail.
- Quit: It will also close the debugger, but the task sequence will continue normally.
Resources
- Microsoft Docs – https://docs.microsoft.com/en-us/mem/configmgr/osd/deploy-use/debug-task-sequence
- SCCM OSD Troubleshooting using SMSTS Log with Vishal | ConfigMgr
- SCCM OSD SMSTS Log File Reading Tips | ConfigMgr | MEMCM
We are on WhatsApp. To get the latest step-by-step guides and news updates, Join our Channel. Click here –HTMD WhatsApp.
Author
Anoop C Nair has been Microsoft MVP for 10 consecutive years from 2015 onwards. He is a Workplace Solution Architect with more than 22+ years of experience in Workplace technologies. He is a Blogger, Speaker, and Local User Group Community leader. His primary focus is on Device Management technologies like SCCM and Intune. He writes about technologies like Intune, SCCM, Windows, Cloud PC, Windows, Entra, Microsoft Security, Career, etc.

