Let’s dive deep into Troubleshooting and Analyzing Windows Telemetry Data using Windows Diagnostic Data Viewer. This post explains Windows Telemetry troubleshooting. Telemetry data is the basis for solutions like Windows analytics. It includes hardware, updates, application uptime, crashes, etc. Let’s Analyse Telemetry Data using Windows Diagnostic Data Viewer.
In this post, we will learn how Diagnostic Data Viewer works, how to troubleshoot a Windows Telemetry data report, and how to reverse engineer the data transferred to Microsoft using the Windows 11 or Windows 10 Telemetry service.
Immediately see the diagnostic data that Microsoft collects from Windows and Office on your device in real time, exactly how it appears when sent. If you’ve chosen Required for your privacy settings, see that Microsoft collects only the data required to help keep your device up-to-date and secure.
If you’ve opted into Optional, see that Microsoft collects diagnostic data from your device that helps improve Microsoft products and services to everyone with a better experience.
Troubleshoot Analyse Telemetry Data using Windows Diagnostic Data Viewer
Last year, I wrote a blog on Telemetry. This area has undergone many transformations and improved greatly. As we know, Desktop analytics will soon replace Windows analytics, which adds many more new features.
For more details on Desktop Analytics, refer to Anoop’s post. Before enabling Telemetry, customers want to understand what data is sent from the computer to Microsoft. Microsoft published documentation on privacy, compliance, and data types collected.
But still, a common question from customers is, “Is there a log on my computer that shows what Microsoft collects data?” The answer is “Yes.” This is possible using the Windows Diagnostic Data Viewer app.
What is Windows diagnostic data?
Windows diagnostic data is technical data sent from Windows devices about the device, OS, and other software performance. Microsoft uses this data to improve the Windows 10 or Windows 11 build and dependent components.
What is the Windows Diagnostic Data Viewer app?
Windows Diagnostic Data Viewer is a tool to review diagnostic data collected from your devices and sent to Microsoft. This tool will help increase trust and confidence for those who want to know what data is transmitted in Telemetry.
This tool can also be used with PowerShell commands. This tool works on Windows 10 1803 and above (and Windows 11).
How to Enable and use Diagnostic Telemetry Data?
There are different ways to enable Telemetry like SCCM, Intune, GPO, Script, etc. For more details, refer here.
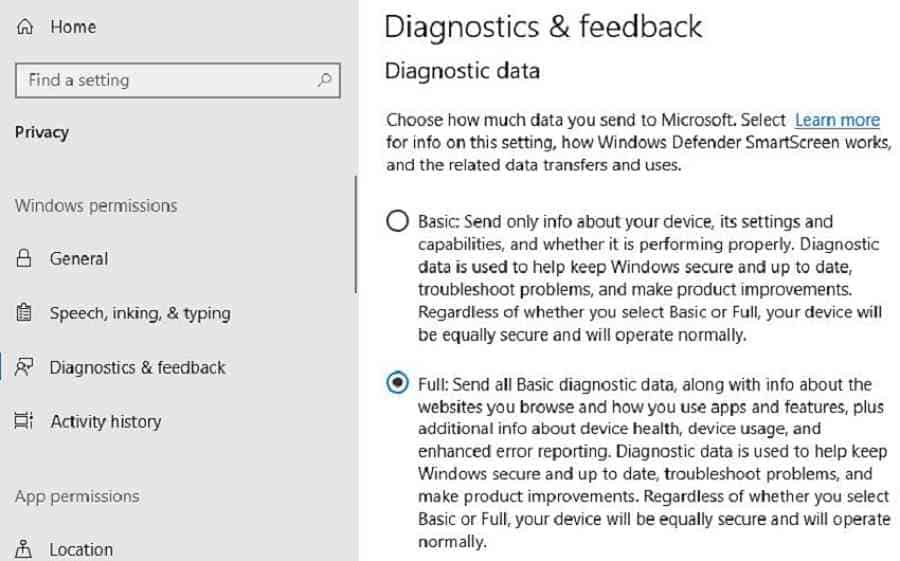
In this post, I will allow the Telemetry to be manually increased to the full, as shown below; in this scenario, Windows will then send the full diagnostic data to Microso.
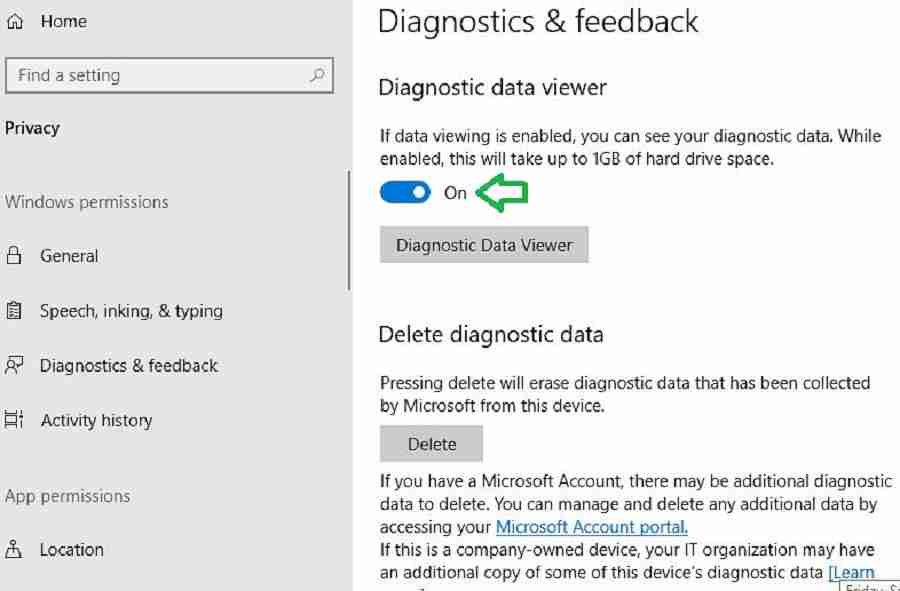
Navigate to Settings > Privacy > Diagnostics & Feedback to enable data viewing. Scroll down to the Diagnostic Data Viewer section and turn the switch “On.”
Where is Windows Telemetry Data Stored?
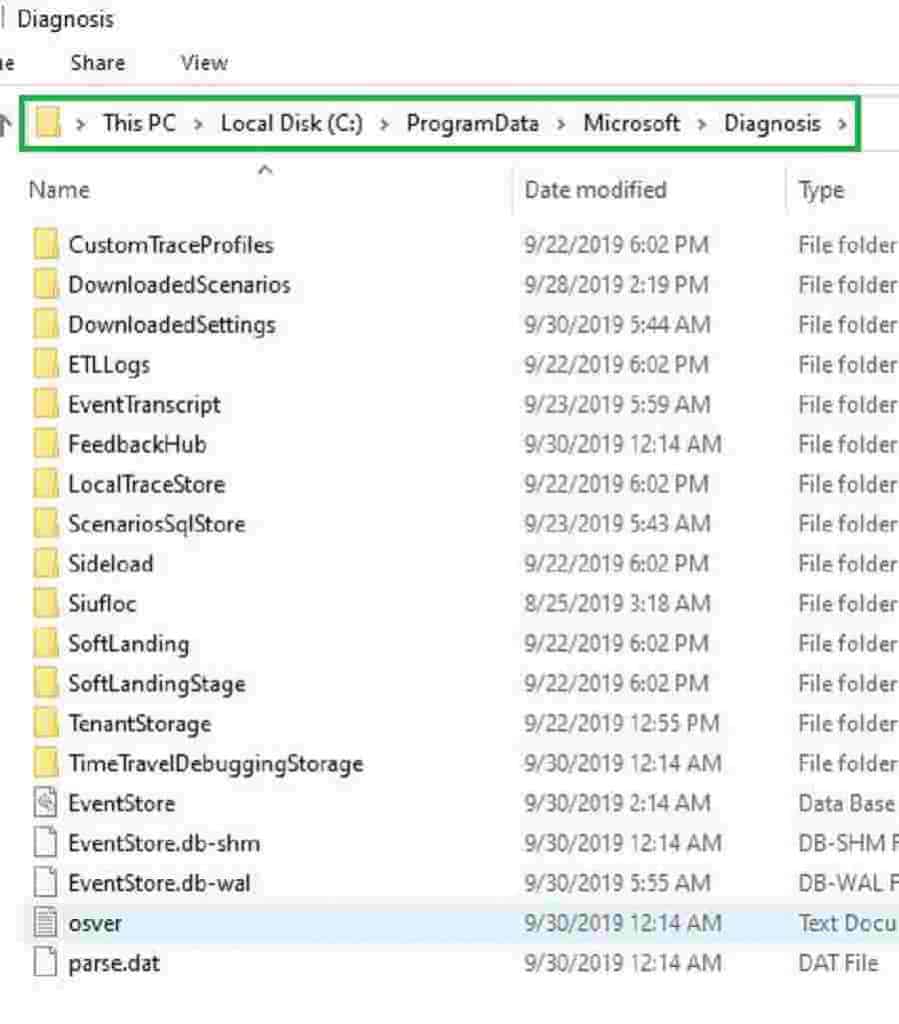
Telemetry data is stored in a hidden folder, % programdata%MicrosoftDiagnostics. The data in this folder is encrypted, so we cannot see any raw data to analyze without a tool.
How to View/Analyse Telemetry Data?
So, let’s install the Windows Diagnostic Data Viewer tool, which is available in the Windows store.
After installation, you can click the “Diagnostic Data Viewer” button. Or launch the “Diagnostic Data Viewer” shortcut that appears in your Start menu.
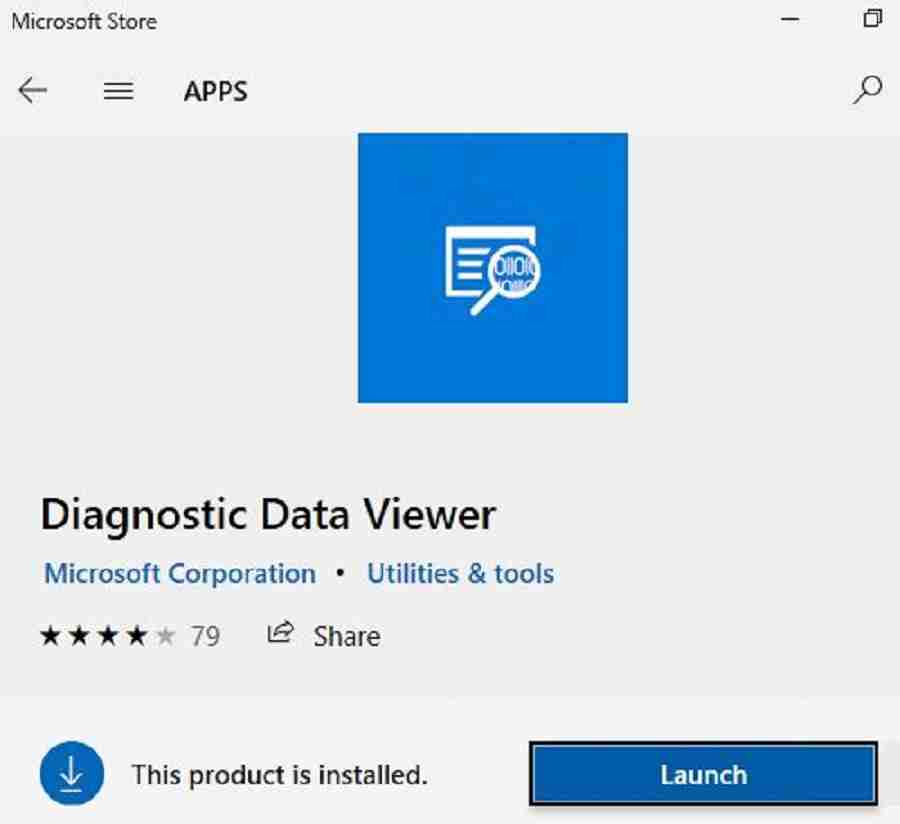
Diagnostic Data Viewer Overview
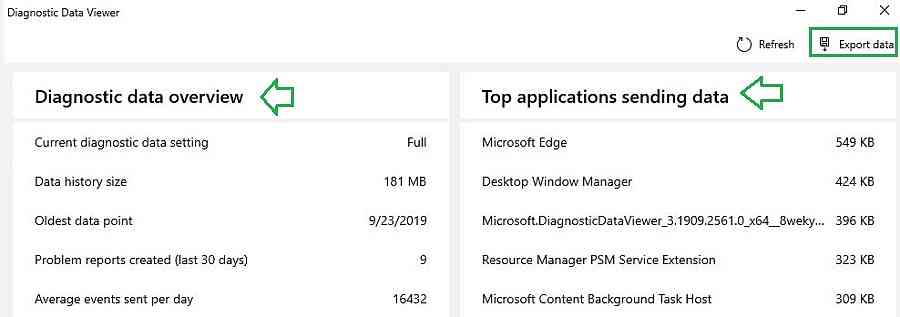
Let’s review the different options in the Diagnostic Data Viewer app. Click on “About your data” for an overview and the top applications sending data.
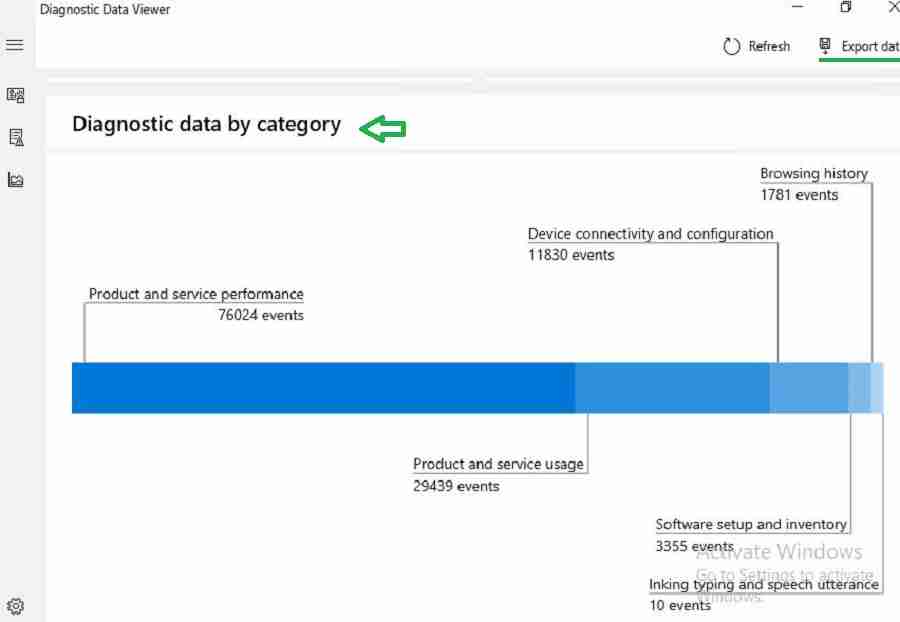
- Navigate below to understand the different categories of diagnostics data. None of the events were captured in each category.
- Click on the top right corner to export this view or data to CSV.
Event categories include:
Troubleshoot Analyse Telemetry Data using Windows Diagnostic Data Viewer using event logs from Windows 11 or 10 devices.
- Browsing history
- Device Connectivity and Configuration
- Inking Typing and Speech Utterances
- Product and Service Performance
- Product and Service Usage
- Software Setup and Inventory
JSON Data – Troubleshoot Analyse Windows Telemetry Data using Windows Diagnostic Data Viewer
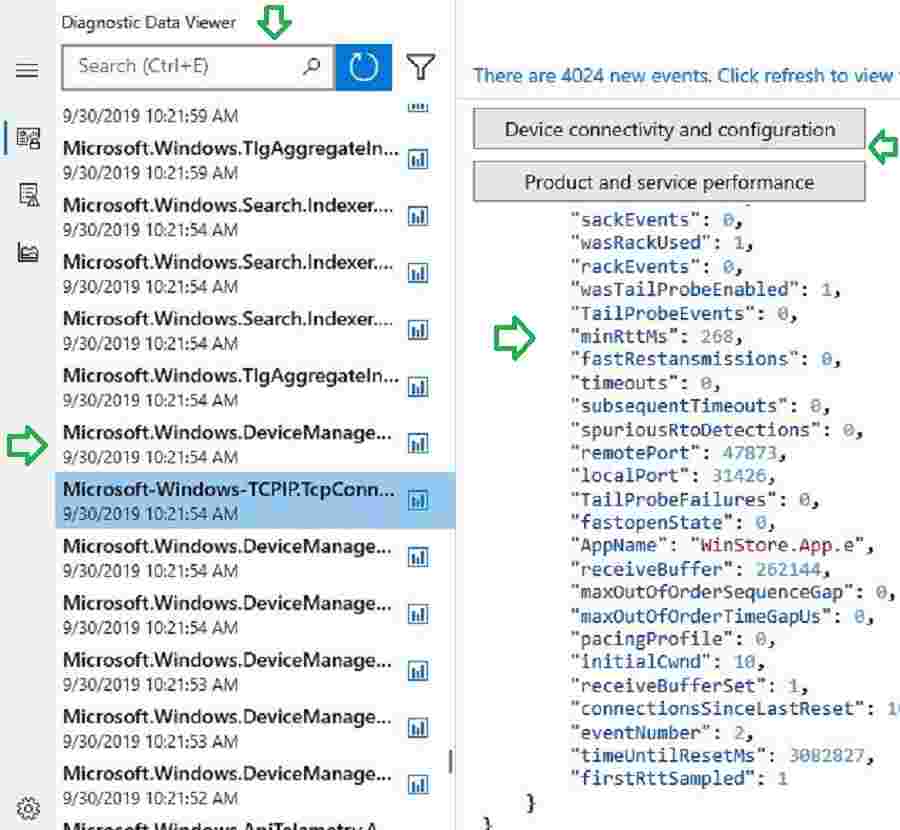
To understand more details about these events, navigate to “view diagnostics data.”
Refer to this link to understand the data types and events collected by diagnostics data. Then use the search feature to check whether a particular data type is getting collected or not.
On the right side, the data is displayed in JSON format. It will also show the category of the information it belongs to. Microsoft uses this event data to understand how the device and app performance.
View Problem Reports with Windows 11 Telemetry Data
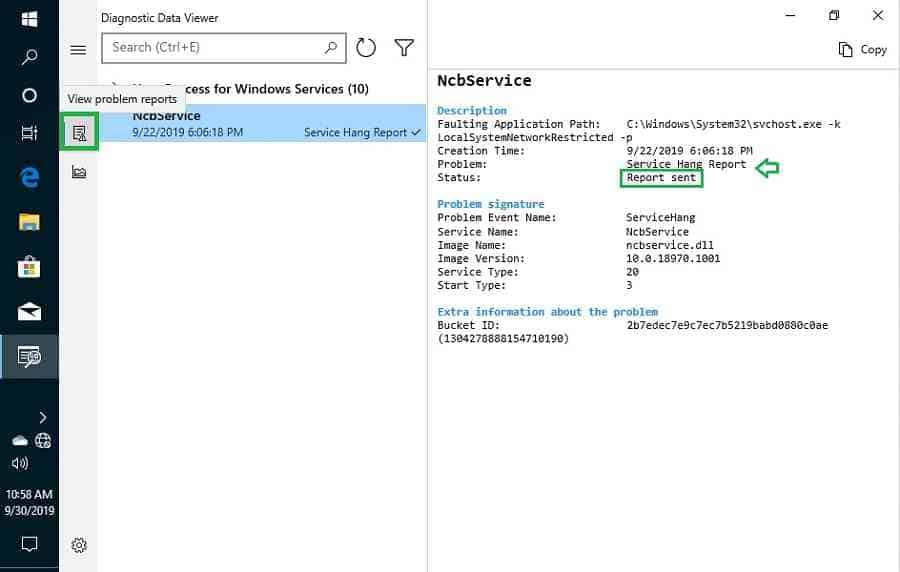
Next, ‘let’s select the “View problem reports” tab. Here you will see problem reports from the system like host process or service hung, etc. We can also check whether this problem report has been sent to Microsoft.
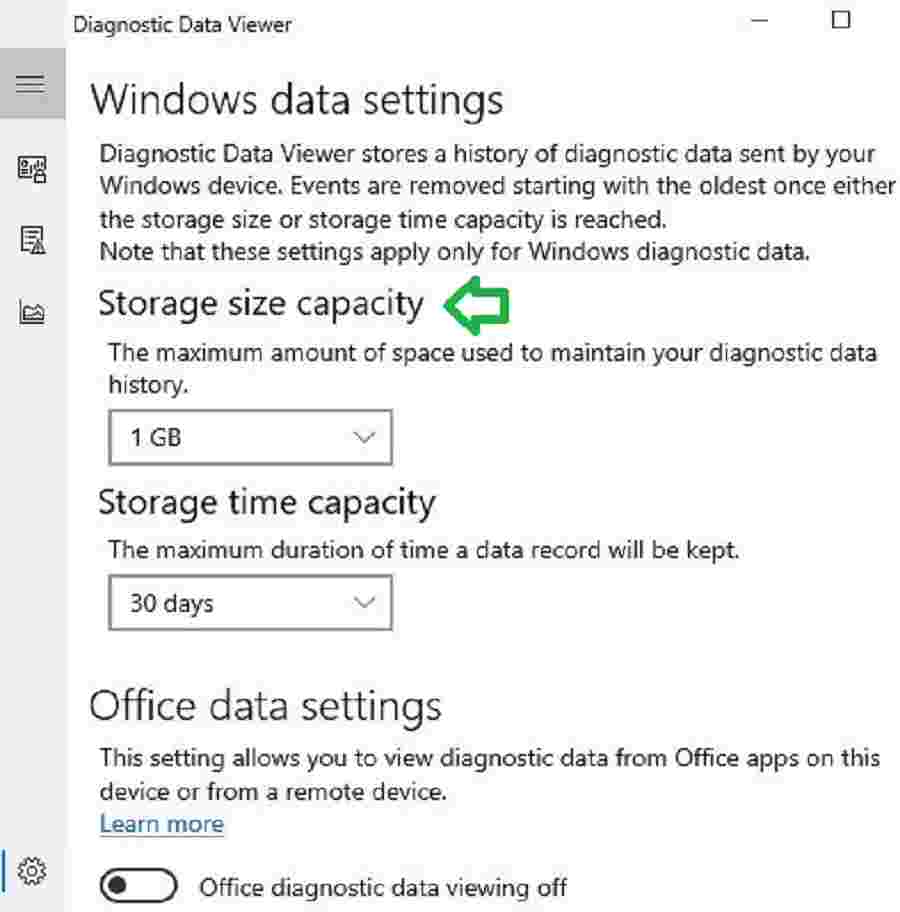
Storage Size Capacity for Windows 11 Telemetry Data
By default, diagnostic data can consume a max of 1 GB of Hard disk and 30 30-day retention period. But you can change the default value if required.
Conclusion – Troubleshoot Analyse Telemetry Data using Windows Diagnostic Data Viewer
At this stage, this tool needs a lot more capabilities. Let’s see whether Microsoft will add more features in upcoming versions.
Overall, this tool is interesting from an analysis and troubleshooting point of view. We can refer to it for guidance when we encounter errors or performance issues. We may find some information in other logs or event viewers.
But I think this tool will be a single pane to view all analytics data from the local computer. Each Telemetry Levit also helps to understand how much data is sent to Microsoft. This will help to decide for those who are concerned about privacy.
Resources
- Define Windows 10 Upgrade Readiness Architecture with SCCM – Part 1
- How to integrate Windows 10 Upgrade Readiness with SCCM – Part 2
- Configure Telemetry for Upgrade Analytics/Readiness with Intune & SCCM – Part 3
We are on WhatsApp. To get the latest step-by-step guides and news updates, Join our Channel. Click here –HTMD WhatsApp.
Author
Vimal has more than 10 years of experience in SCCM device management solutions. His main focus is on Device Management technologies like Microsoft Intune, ConfigMgr (SCCM), OS Deployment,Patch Management. He writes about the technologies like SCCM, Windows 10, Microsoft Intune and MDT.

