Let’s have a look at AVD Azure Monitor Diagnostic Settings Setup. Let’s have a look what are the default AVD utilization dashboard available with Azure Monitor.
You can get the details of CPU usage; Daily connected hours, and Session history from the AVD insights workbook using Azure Monitor for AVD.
To start using Azure Monitor for AVD, you will need a Log Analytics workspace. Also, you will need to have a few diagnostic configurations enabled for the Host Pool, Workspaces, Application Groups, etc. I have also used the log analytics workspace to send the diagnostic data.
The AVD health checks and monitoring options are important for all AVD deployments. The Azure Monitor for AVD insights dashboard should be part of your AVD daily monitoring checks.
It would help if you remembered that the Log Analytics workspace data cost you some additional charges apart from the basic AVD charges. There will be Standard data storage charges for the Log Analytics. For testing, you can choose the pay-as-you-go model.
You will need to provide read-only access to your monitoring team to access the AVD utilization dashboard. Read-only access is required to Azure Subscription, Resource Groups, and Log Analytics Workspace. These permissions are to view the data. Additional permissions are required to manage resources in AVD.
- AVD Health Checks Using Azure Portal | Monitoring | KQL Queries
- FIX: AVD Azure AD Joined VM Login Issue With Error Code 0x9735
- AVD VM RD Client Connection Error 0x83886181
AVD Azure Monitor Diagnostic Settings Setup
Let’s see how to configure AVD diagnostic settings. You will need to set this up from the Host Pool and Workspaces. These configurations will help to collect the configured data from the AVD infrastructure. Once the diagnostic data is collected, the Workbook will populate the Azure Monitor Dashboards (AVD Utilization Dashboard) for AVD.
Diagnostic settings are used to configure to collect and export predefined logs and metrics for a resource to the destination of your choice. You have options to create up to five (5) different diagnostic settings to send various logs and metrics to independent destinations.
NOTE! – NO Diagnostic settings Defined means there is no diagnostic configuration defined, and you will need to follow the steps mentioned below.
- Navigate to Azure Portal – Azure Virtual Desktop.
- Click on the hostpool where you want to enable diagnostic data.
- Scroll down until you find Monitoring – Daignostic Settings Tab.
- Click on + Add Diagnostic Setting link
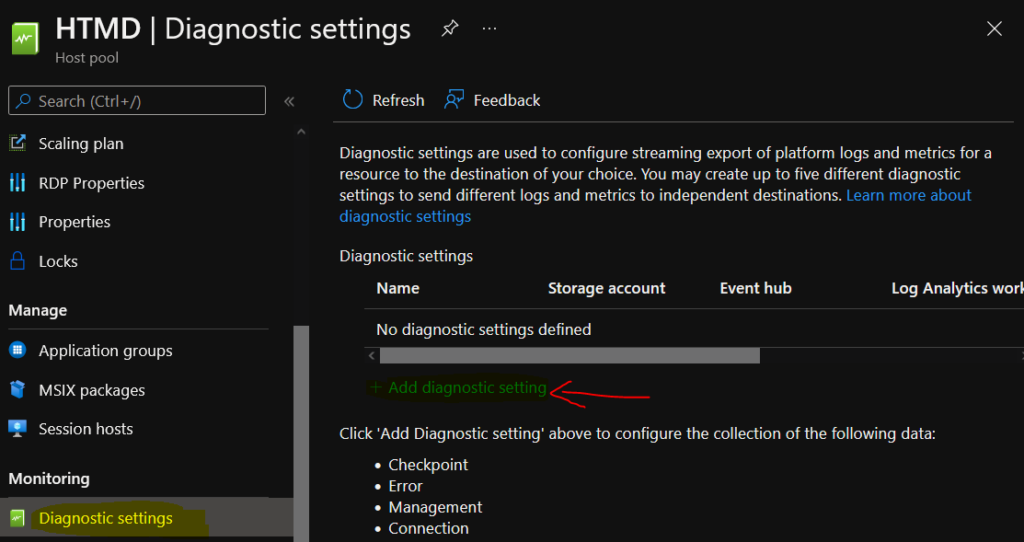
Once you click on the ‘Add Diagnostic setting’ as mentioned above, you will get the option to select the types of logs you want to collect from the AVD infrastructure. Also, you will get an option to choose the Destination to send the logs to.
The following are the log file categories for Host Pool Diagnostic data.
Checkpoint
Error
Management
Connection
HostRegistration
AgentHealthStatus
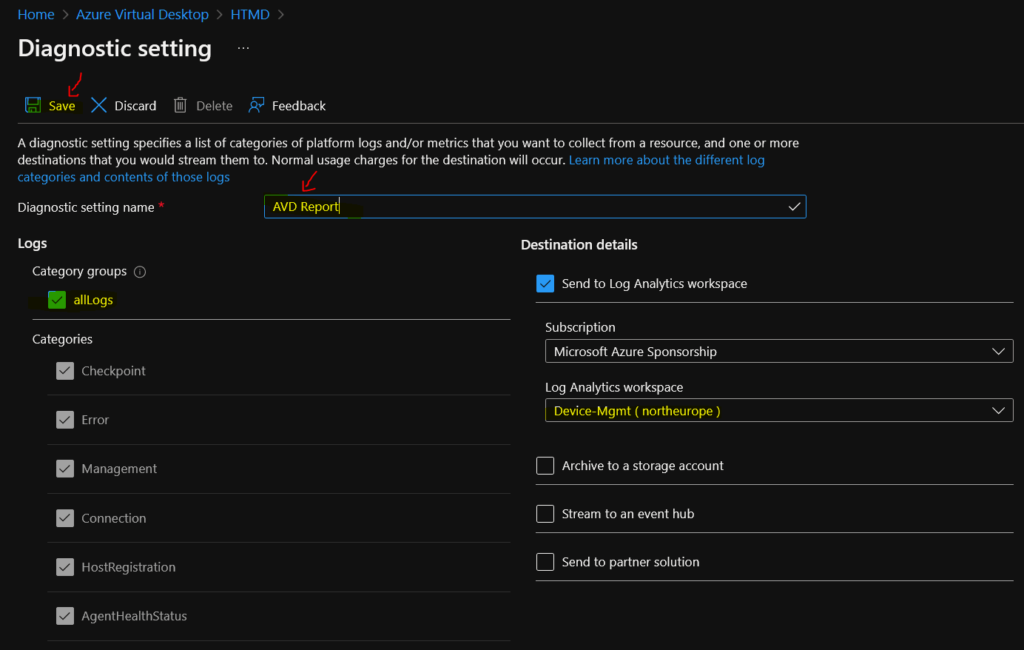
A diagnostic setting specifies a list of categories of platform logs and/or metrics that you want to collect from a resource and one or more destinations that you would stream them to. Normal usage charges for the destination will occur.
- Enter a Name for Diagnostic Settings.
- Select All Logs for testing purposes (you can change it afterward if you want).
- Select the destination details – Send to Log Analytics Workspace.
- Select the Subscription.
- Select the Log Analytics Workspace.
- Click on the SAVE button.
NOTE! – If you don’t see any Log Analytics workspace from the drop-down list, you will need to create at least one log analytics workspace for this AVD utilization dashboard (Azure Monitor). Or you don’t have access to the Log Analytics workspace.
- Create a Log Analytics workspace in the Azure portal – Azure Monitor | Microsoft Docs
- https://docs.microsoft.com/en-us/azure/virtual-desktop/diagnostics-log-analytics
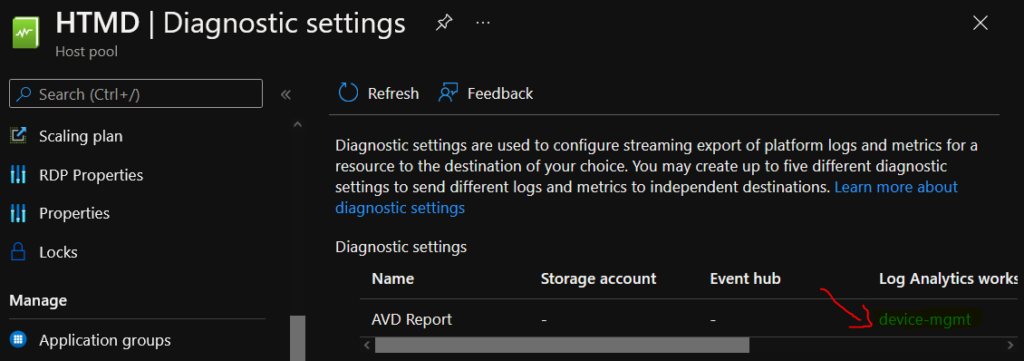
You are all set to collect the data from AVD infrastructure and Session hosts. To collect data from Session Hosts, you will need the Azure Monitor agent, which provides all capabilities necessary to collect guest operating system monitoring data.
You can get more details about other diagnostic settings configurations from the following docs.
https://docs.microsoft.com/en-us/azure/azure-monitor/agents/agents-overview and Use Monitor Azure Virtual Desktop Monitor – Azure | Microsoft Docs
AVD Utilization Dashboard using Azure Monitor Insights
You can get the AVD Utilization Dashboard using Azure Monitor Insights. You will need to have appropriate access (Read-Only) to Azure Subscription, Resource Group, and Host Pool to show insights into the AVD environment.
- Navigate to Azure Portal – Azure Virtual Desktop.
- Scroll down to Monitoring – Insights.
- Select the Subscription, Resource Group, and Host Pool from the drop-down menu.
- Click on Utilization Tab to see the insights of AVD utilization.
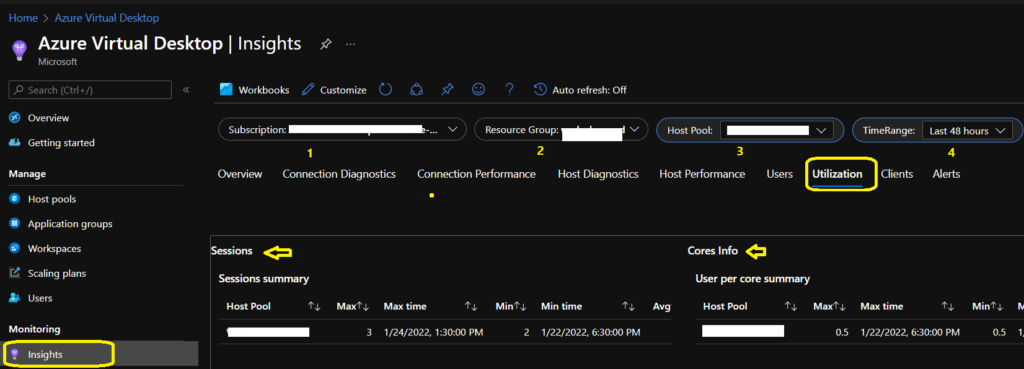
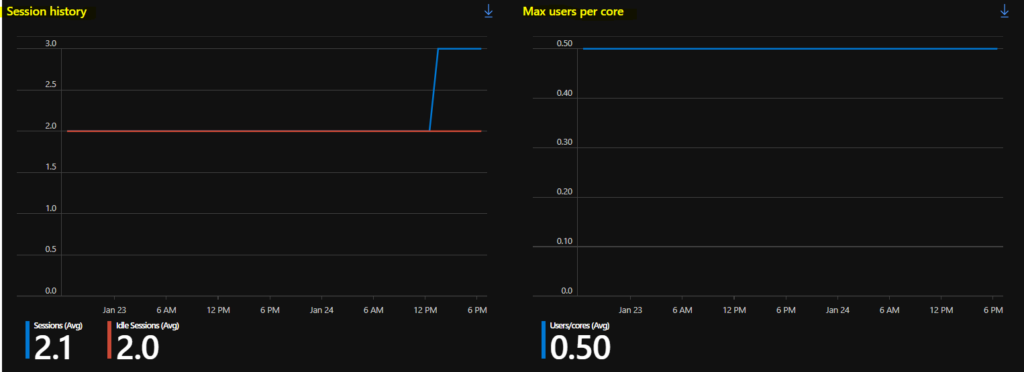
You can check the Session History graph, which will show you the active and idle sessions. For a small test environment:
- 2.2 Sessions (Avg)
- 2.0 Idle Sessions (Avg)
On the other side, you would see Max users per core. I see 0.50 Users/Crores (Avg).
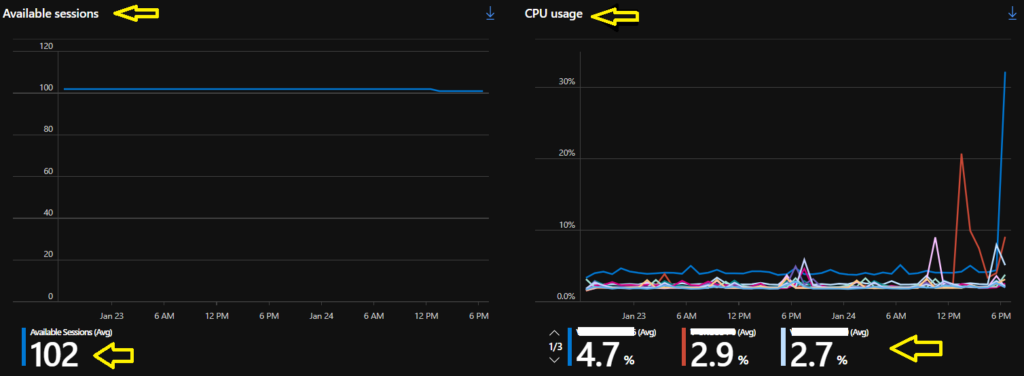
The other dashboards available are Available Sessions for the host pool that you have selected and CPU usage for the session hosts inside that host pool.
- Available Sessions (Avg) = 102
- You can see the CPU usage for each individual Session Host (VMS).
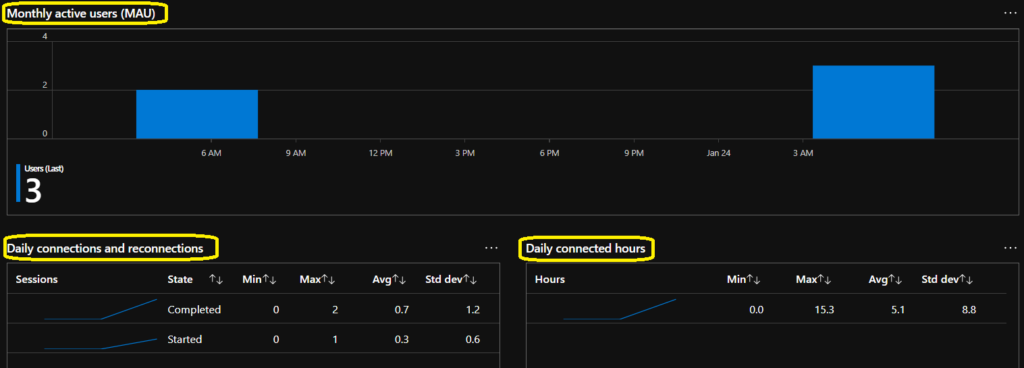
The next dashboard on AVD utilization shows the insights of Monthly Active Users (MAU). I see only 3 monthly active users in the test environment. You can also get the following details from the AVD utilization dashboard.
- Daily connections and reconnections
- Daily connected hours
Top 10 users by connection time and Top 10 hosts by connection time are two useful dashboards available as part of Azure Monitor Insights. These types of insights help the admin make the decision to upgrade the SKU for some set of users to improve the user experience and performance of the VMs.

To configure Azure Monitor for Azure Virtual Desktop Insights, see the Configuration workbook and follow the setup instructions. https://docs.microsoft.com/en-us/azure/virtual-desktop/azure-monitor.


Is it possible to have access to AVD insight workbook only after granting access to resourcegroup level. As my log analytics workspace is in different subscription and AVD hostpool in different subscription. I need to provide access to helpdesk team so that they can view only AVD Insight.